Hi, I'm Beatriz.

I am a Data Visualization designer and developer, with a strong background in research.

After graduating as a Sociologist and a Advertising & PR, I started my professional career as a researcher. I worked simultaneously doing user research for digital products and carrying out social studies. I loved and I still love being a researcher, but what attracted me the most was finding and communicating revealing insights in a clear and engaging way.

In 2012 I started out on my self-taught Data Visualization journey. That was when code came into my life. I also realized that developing the visualizations was as fun as finding and communicating the research insights. I specially enjoy working with D3.js, in which I specialized.

One year later I started my career as a Data Visualizer. That's 10 years of experience already.

Currently, I work creating unique, made-to-order data visualizations, expressly designed for a specific dataset, so I mainly work with static data, no matter how big or small. I also create reusable data visualizations, for those datasets with identical structure but different content.

I love mails, hearing about new projects and challenges so feel free to contact me with any questions, any data project or even just to say hello.

Click to copy email address

beatriz@visualizados.com

Cultural Grants Archive

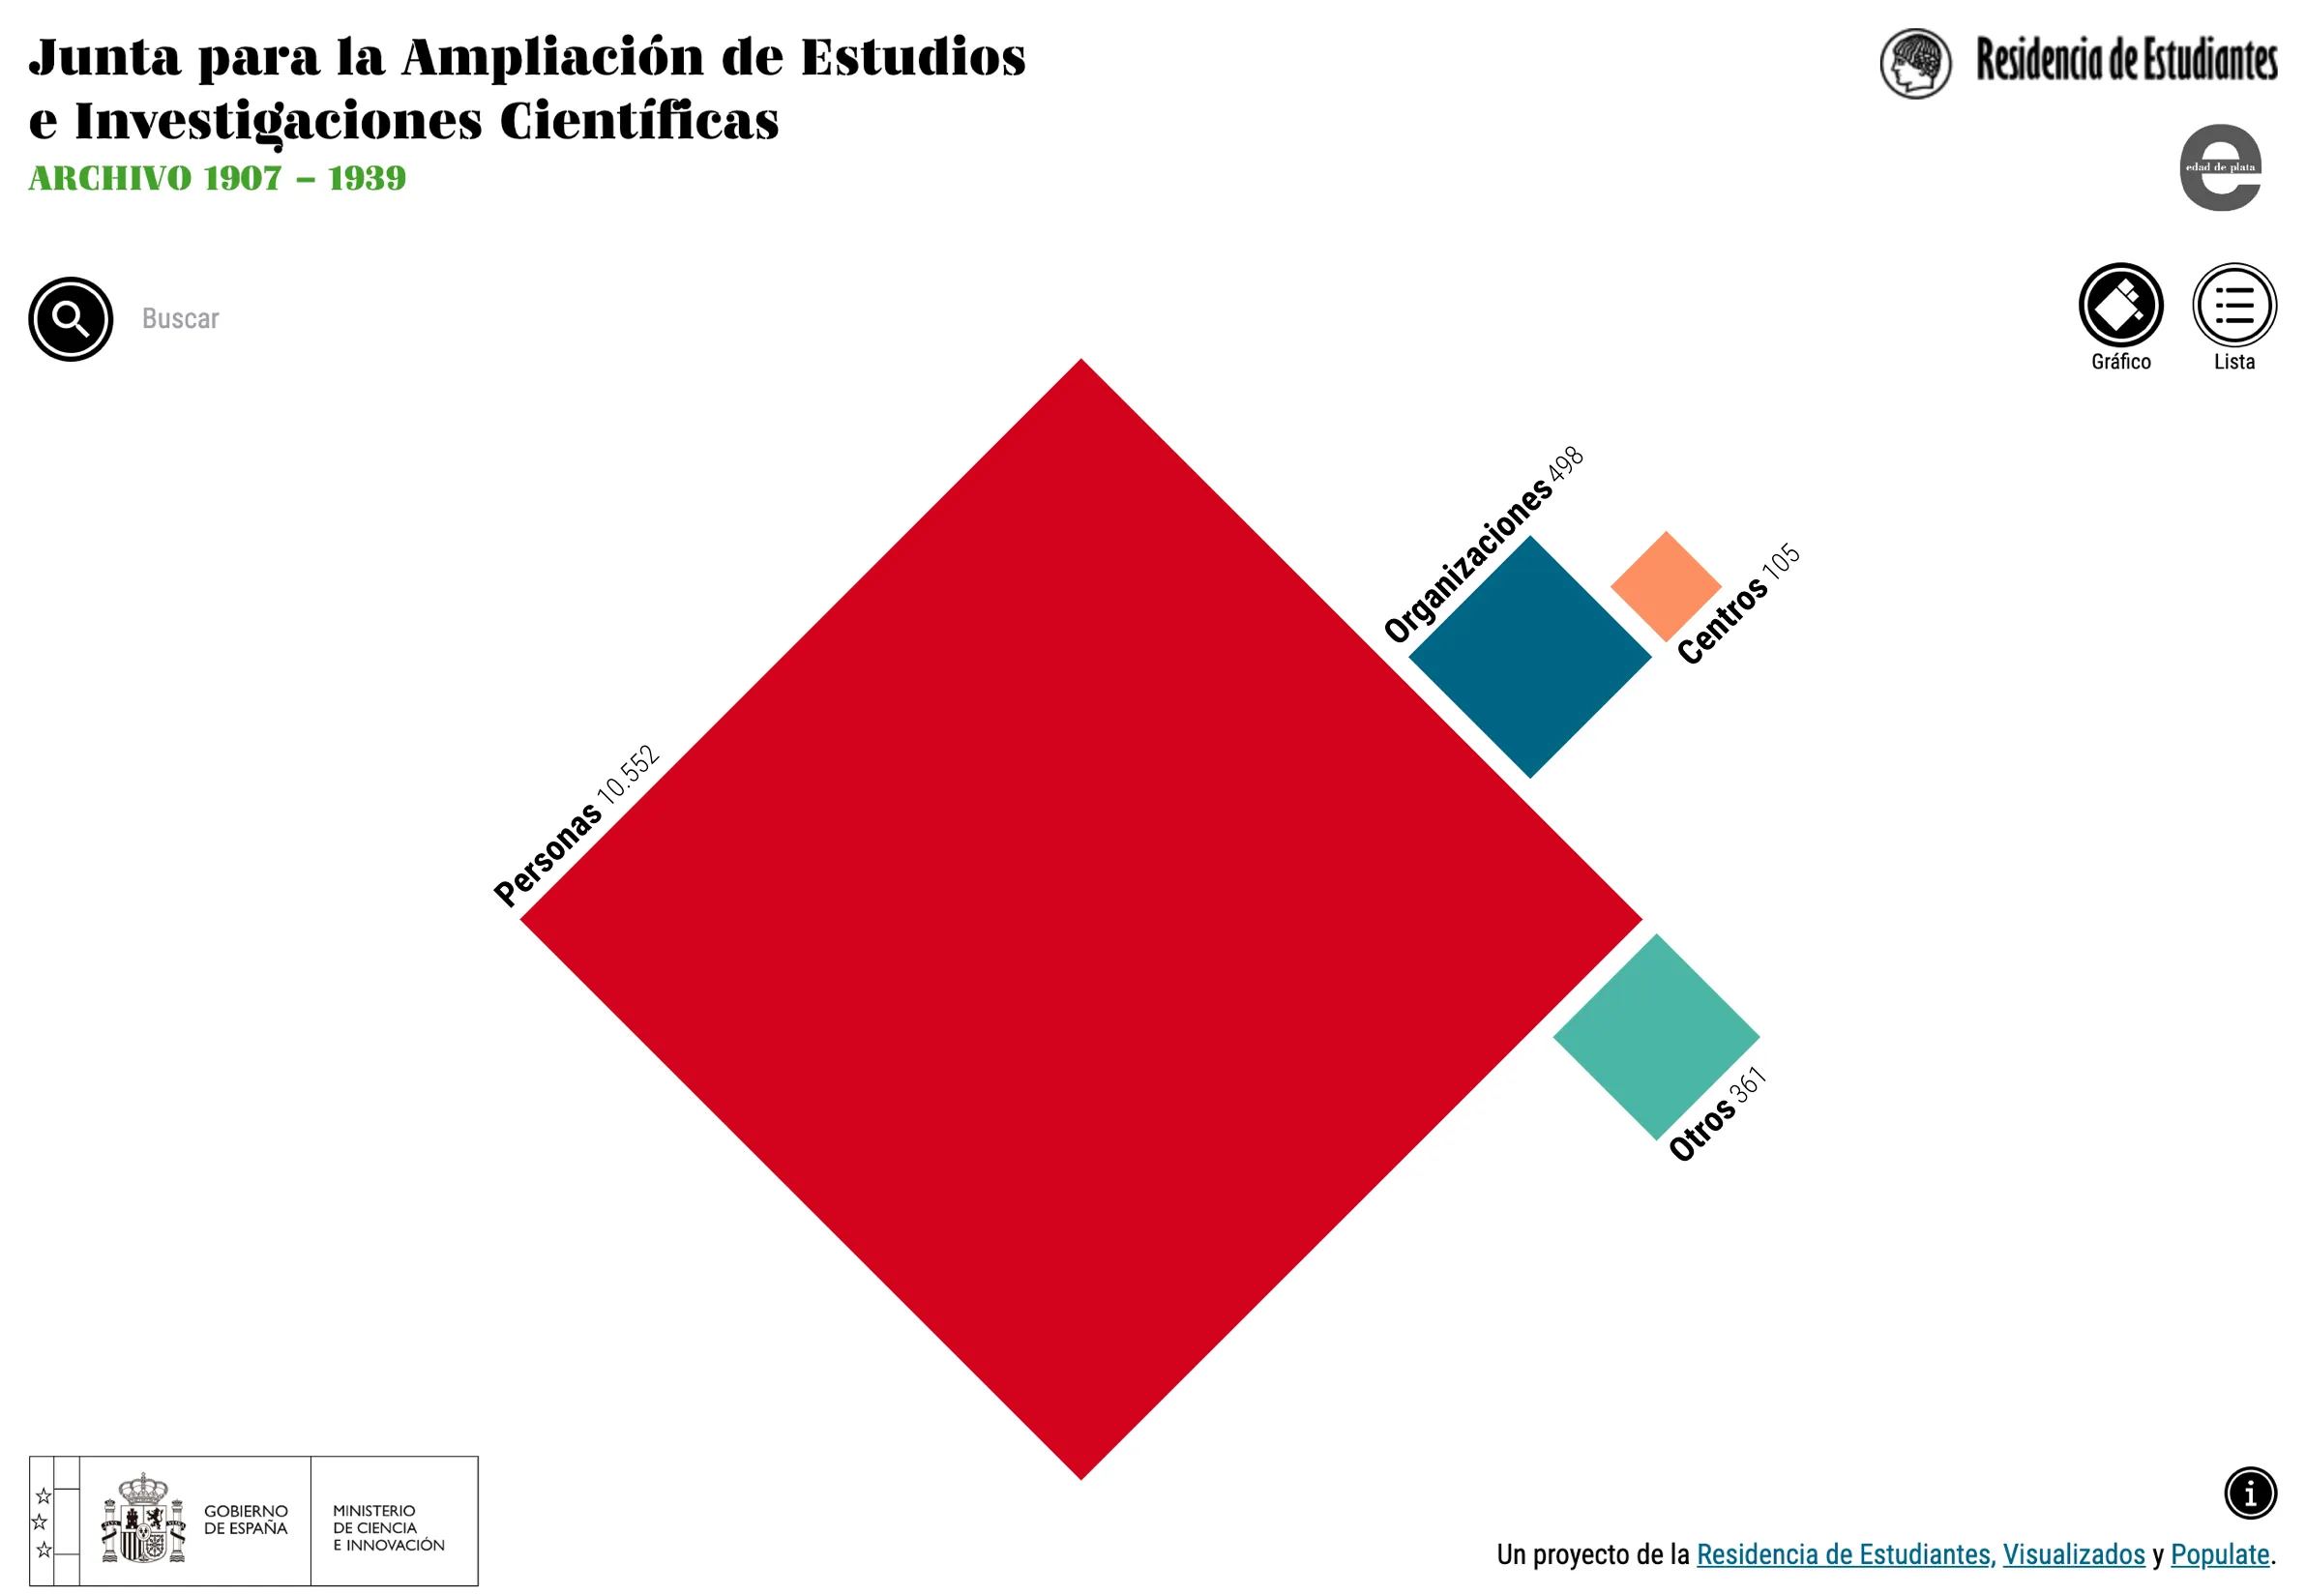
The ‘Student Residence’ was the centre of Spanish cultural life during the early decades of the 20th century. One of its programs was to support its residents' careers by helping them to expand their studies. Through the 'Board for Advanced Studies and Scientific Research,' they approved over 10,000 grants for studying abroad.

Of course, a detailed record of every person or organization involved in the project was carefully stored in the program's archive. The files were digitized several years ago. They also developed an exploration tool that urgently required a technical update.

The client came to me, asking for a complete reconstruction: not only the technology should be renovated, but also the design, the information displayed and the way of exploring it.

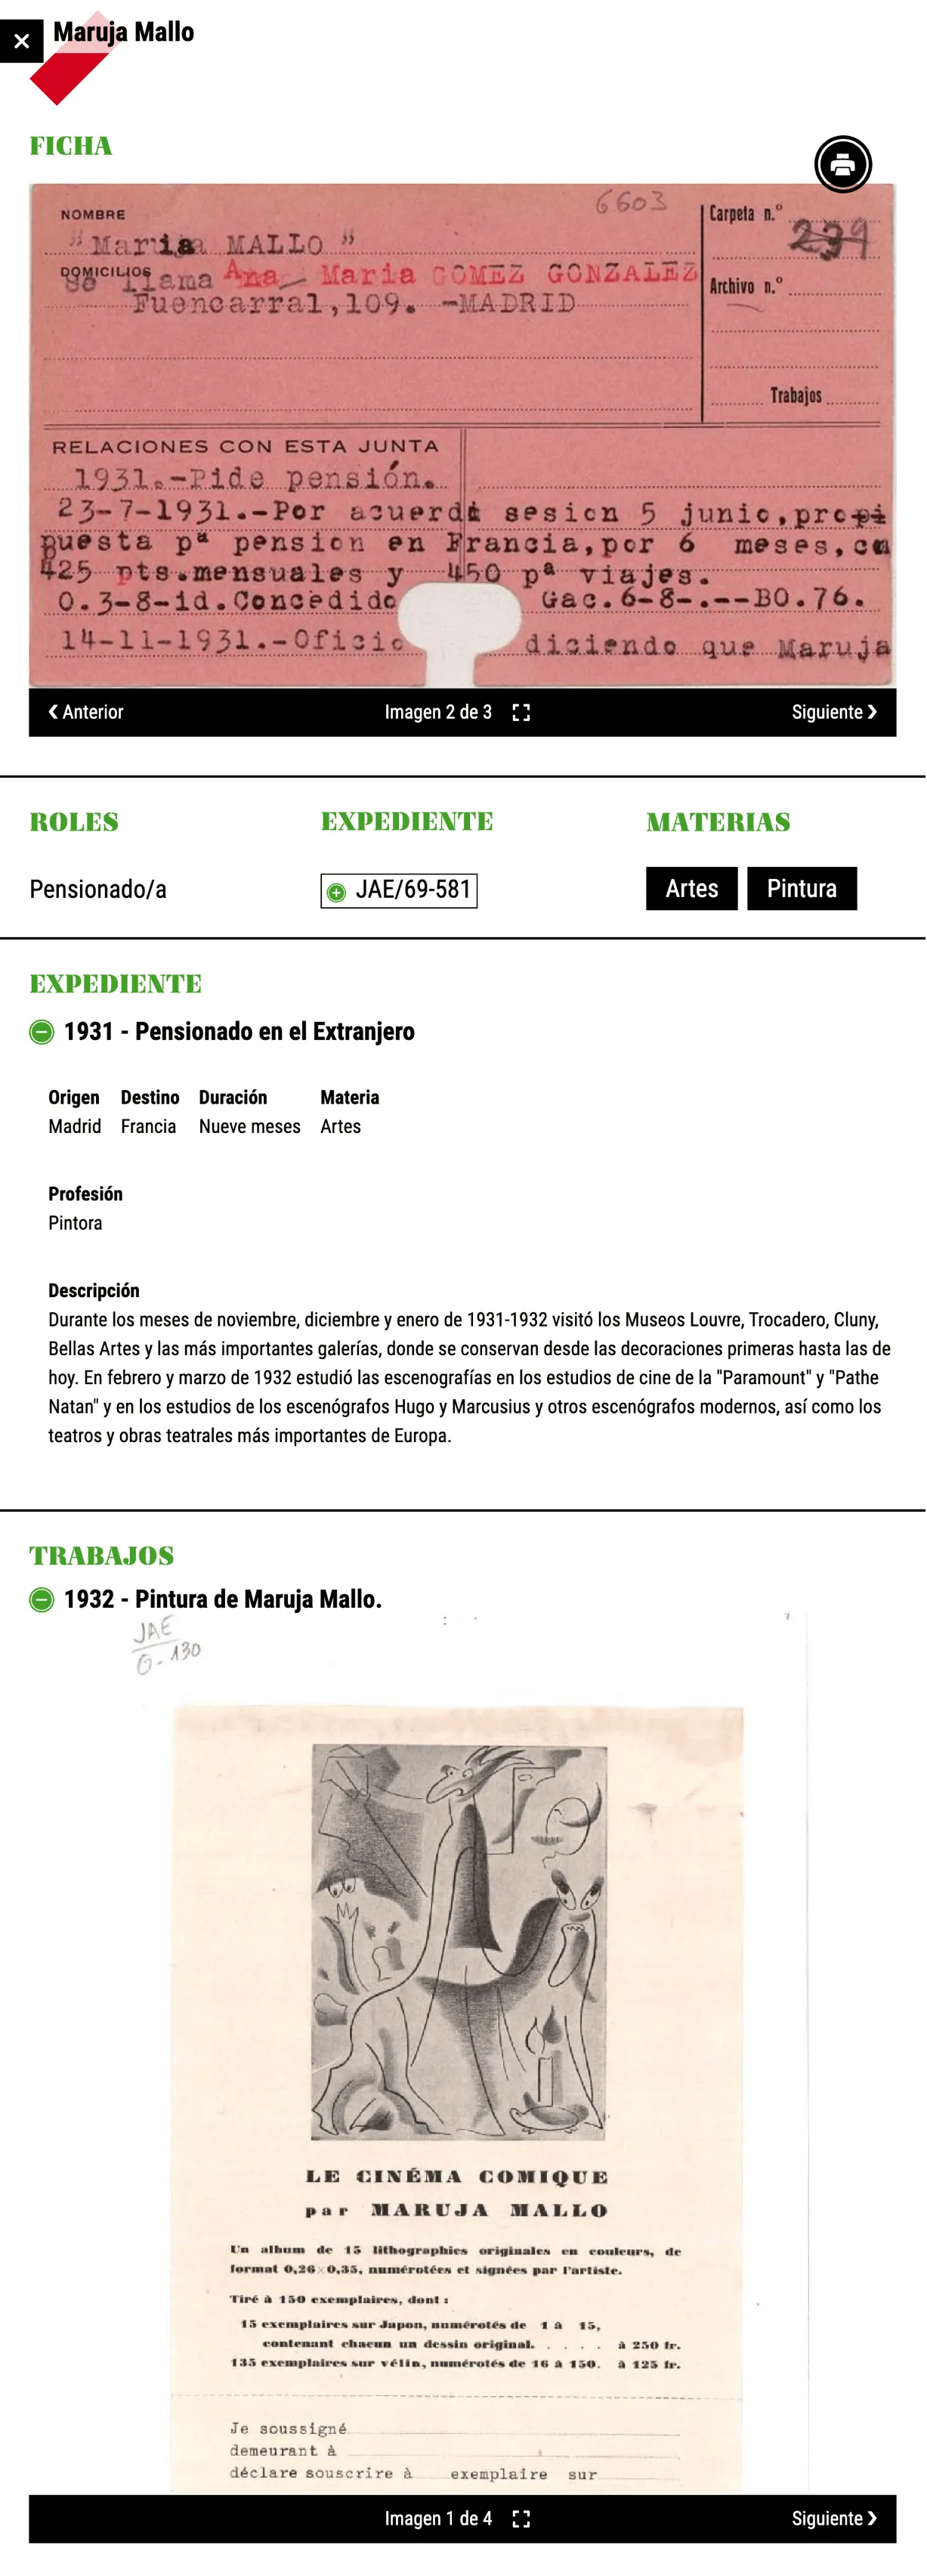
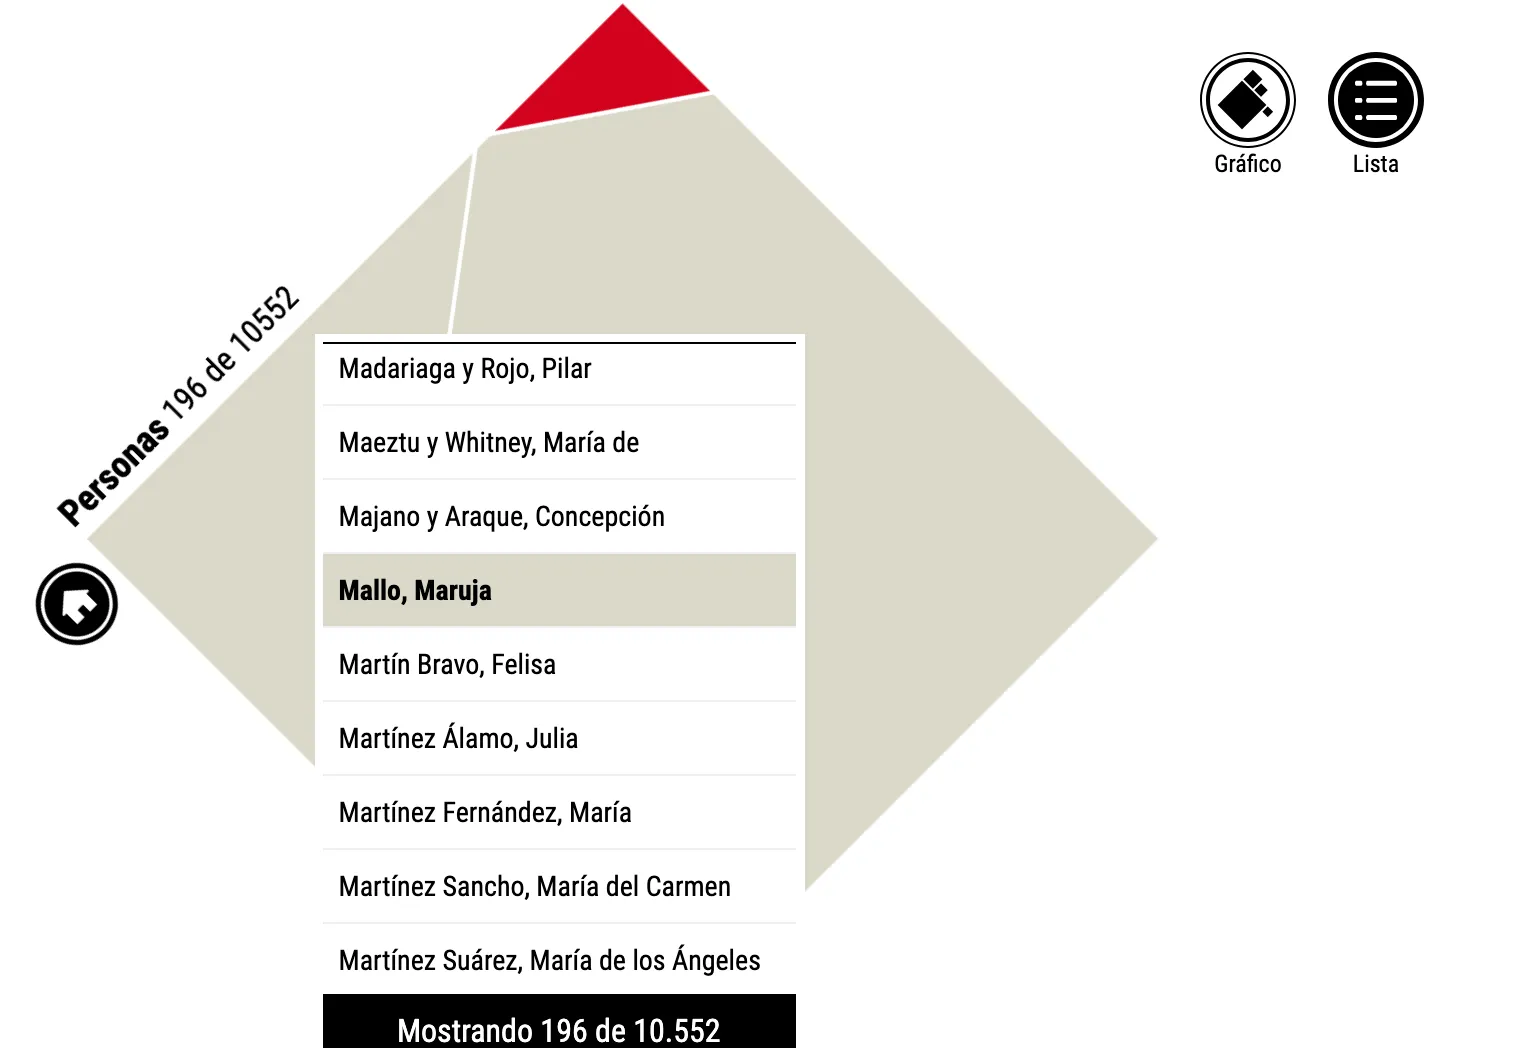
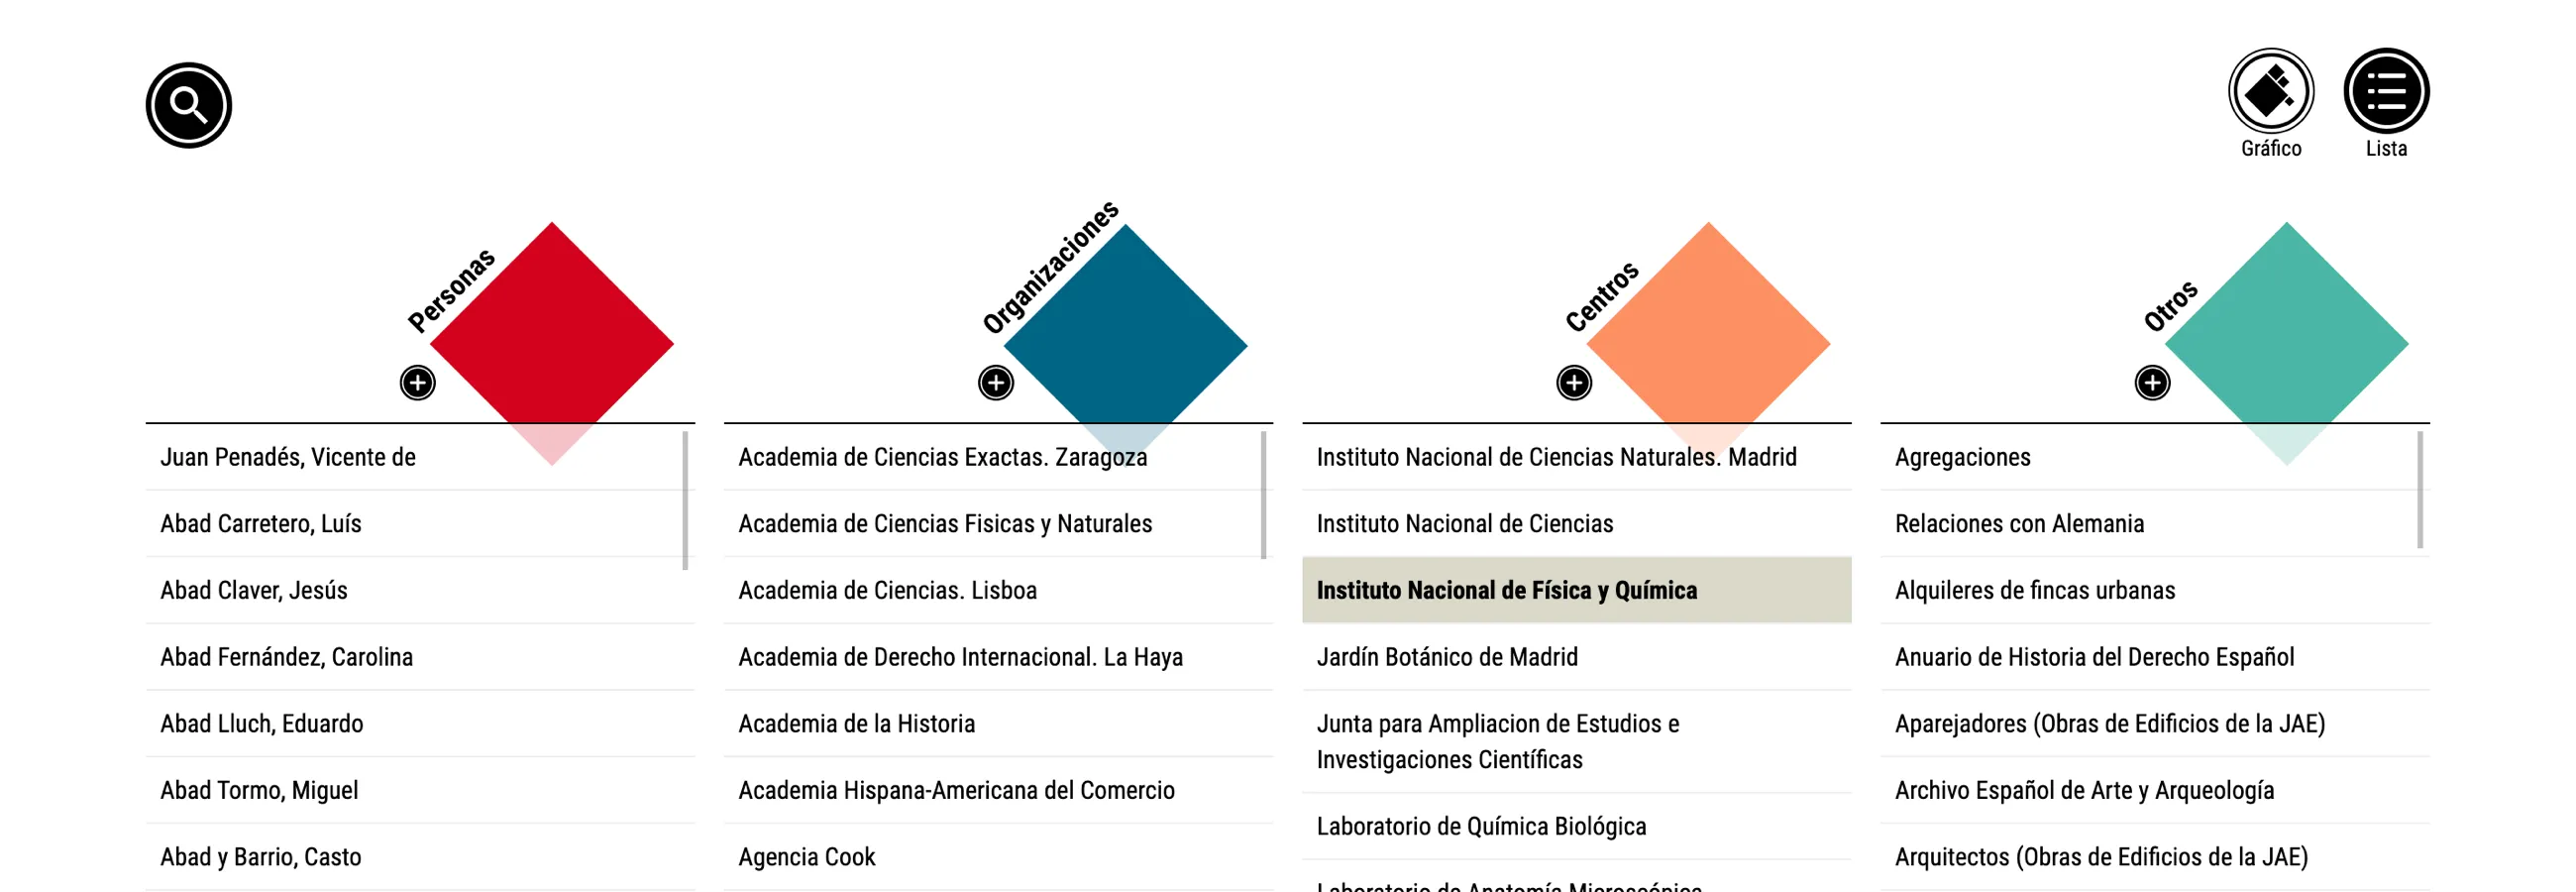
I designed a data visualization with a clean and appealing layout, where the navigation meets the standards. The list view allows to dig deeply in each record, which contains information about the students' travels, works, articles and papers. You can even read them!