Hi, I'm Beatriz.

I am a Data Visualization designer and developer, with a strong background in research.

After graduating as a Sociologist and a Advertising & PR, I started my professional career as a researcher. I worked simultaneously doing user research for digital products and carrying out social studies. I loved and I still love being a researcher, but what attracted me the most was finding and communicating revealing insights in a clear and engaging way.

In 2012 I started out on my self-taught Data Visualization journey. That was when code came into my life. I also realized that developing the visualizations was as fun as finding and communicating the research insights. I specially enjoy working with D3.js, in which I specialized.

One year later I started my career as a Data Visualizer. That's 10 years of experience already.

Currently, I work creating unique, made-to-order data visualizations, expressly designed for a specific dataset, so I mainly work with static data, no matter how big or small. I also create reusable data visualizations, for those datasets with identical structure but different content.

I love mails, hearing about new projects and challenges so feel free to contact me with any questions, any data project or even just to say hello.

Click to copy email address

beatriz@visualizados.com

Women fertility & Age

Sanitas, a leading international health company, wanted to publish an article about female fertility on their data blog. Although the company had some registered data, it wasn't sufficient to tell a story.

Since there wasn't data enough, I conducted an extensive desk research, digging through scientific papers and official data sources. By gathering all the information I got the knowledge to explain the phenomenon of female fertility on a global scale (while recognizing that every woman's body is unique, of course).

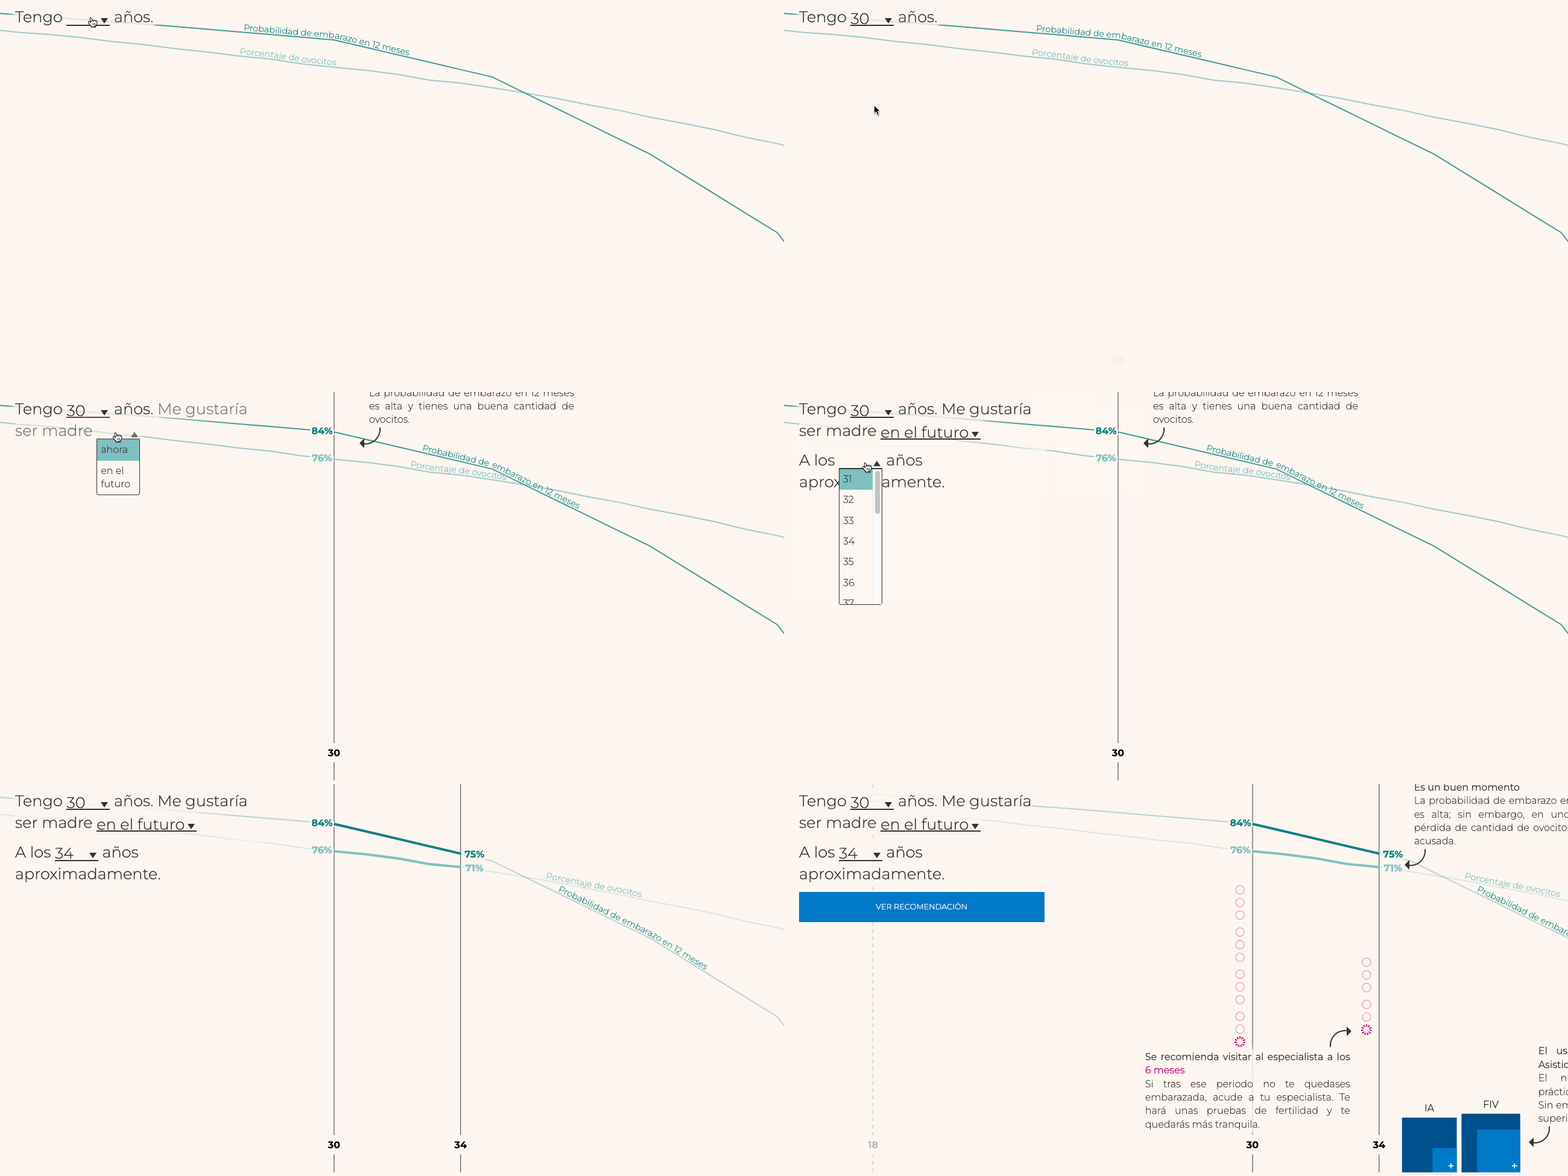
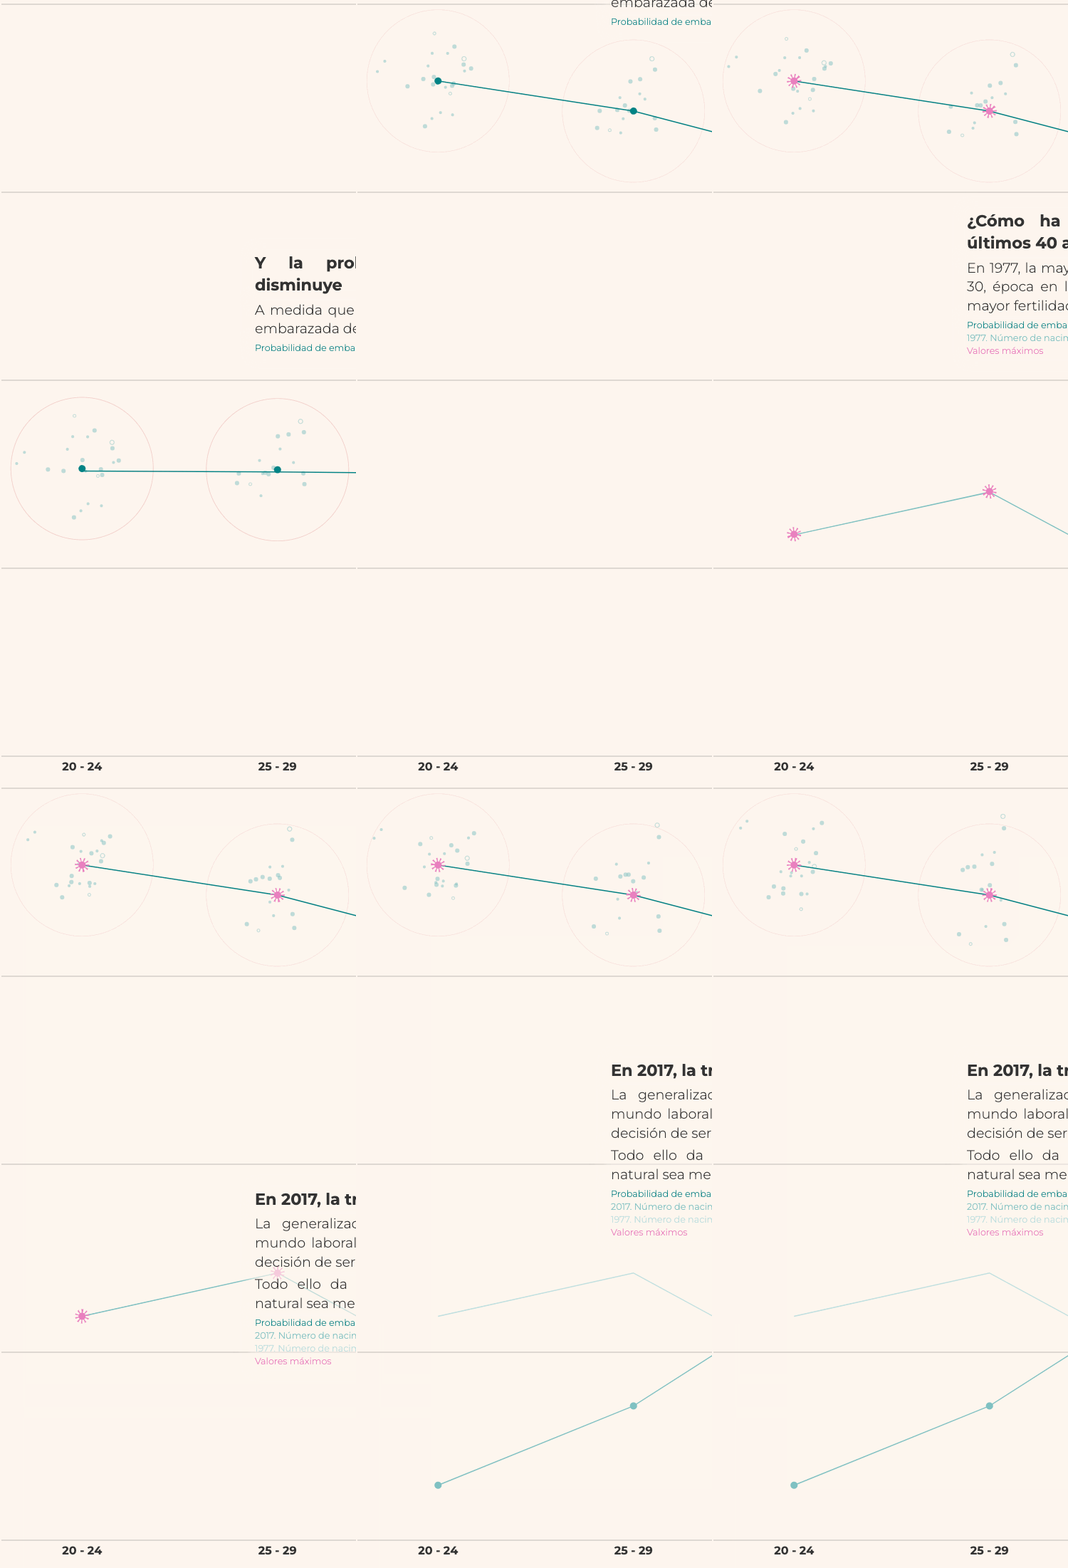
Once I had all the details, I designed and developed a compelling storytelling and an interactive recommender that visually illustrates how female fertility varies over time, providing users with a clear and concise explanation of the phenomenon.

Conversations home screen Conversations home screen Conversations home screen