Hi, I'm Beatriz.

I am a Data Visualization designer and developer, with a strong background in research.

After graduating as a Sociologist and a Advertising & PR, I started my professional career as a researcher. I worked simultaneously doing user research for digital products and carrying out social studies. I loved and I still love being a researcher, but what attracted me the most was finding and communicating revealing insights in a clear and engaging way.

In 2012 I started out on my self-taught Data Visualization journey. That was when code came into my life. I also realized that developing the visualizations was as fun as finding and communicating the research insights. I specially enjoy working with D3.js, in which I specialized.

One year later I started my career as a Data Visualizer. That's 10 years of experience already.

Currently, I work creating unique, made-to-order data visualizations, expressly designed for a specific dataset, so I mainly work with static data, no matter how big or small. I also create reusable data visualizations, for those datasets with identical structure but different content.

I love mails, hearing about new projects and challenges so feel free to contact me with any questions, any data project or even just to say hello.

Click to copy email address

beatriz@visualizados.com

Magazines

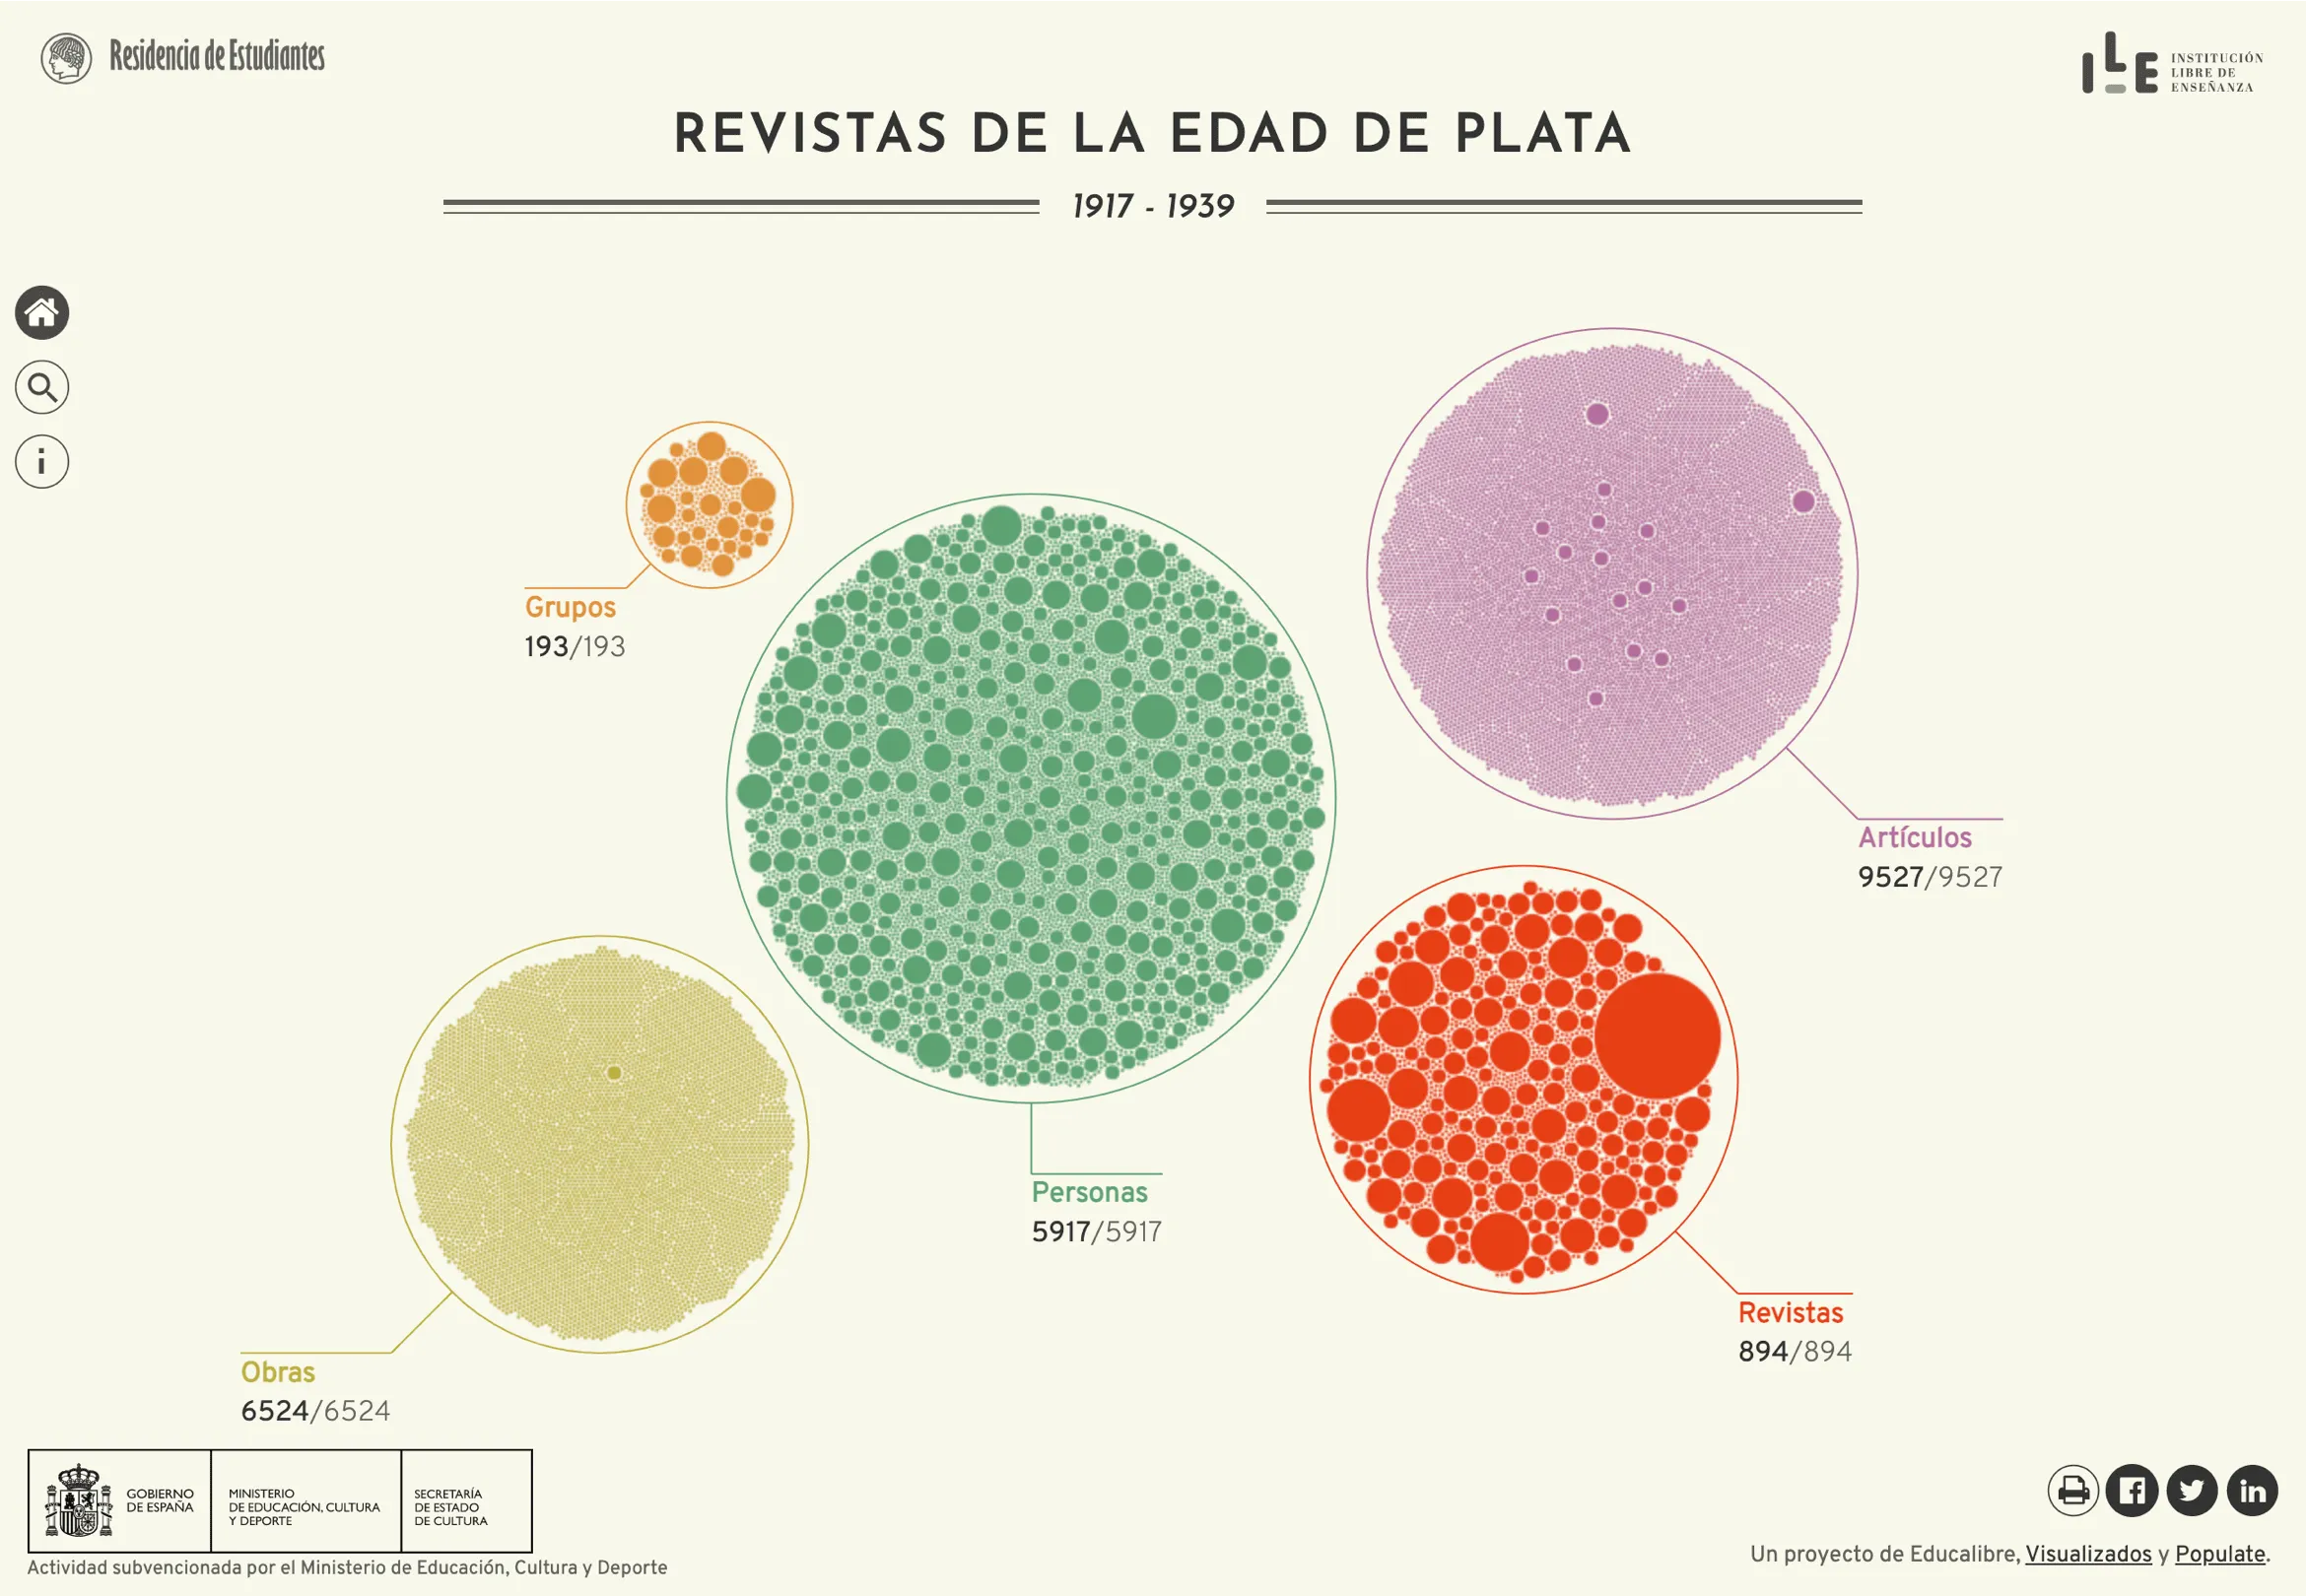
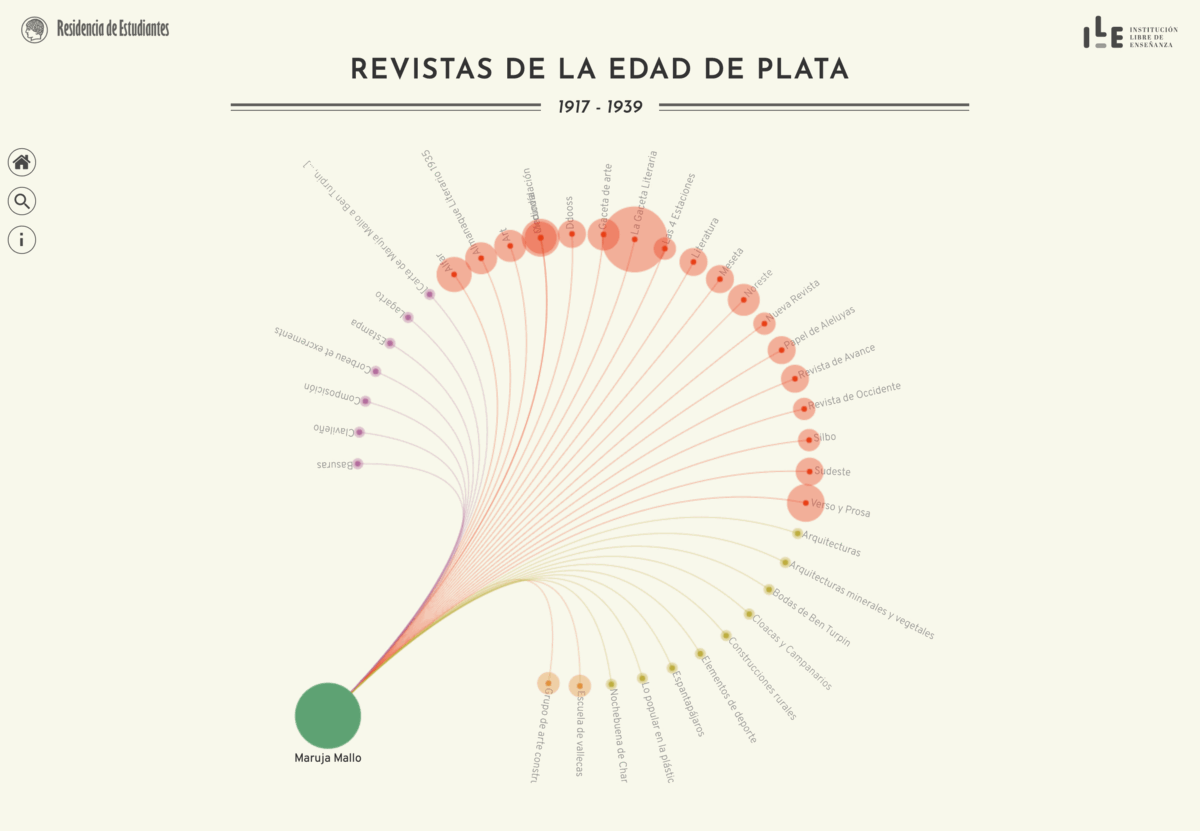
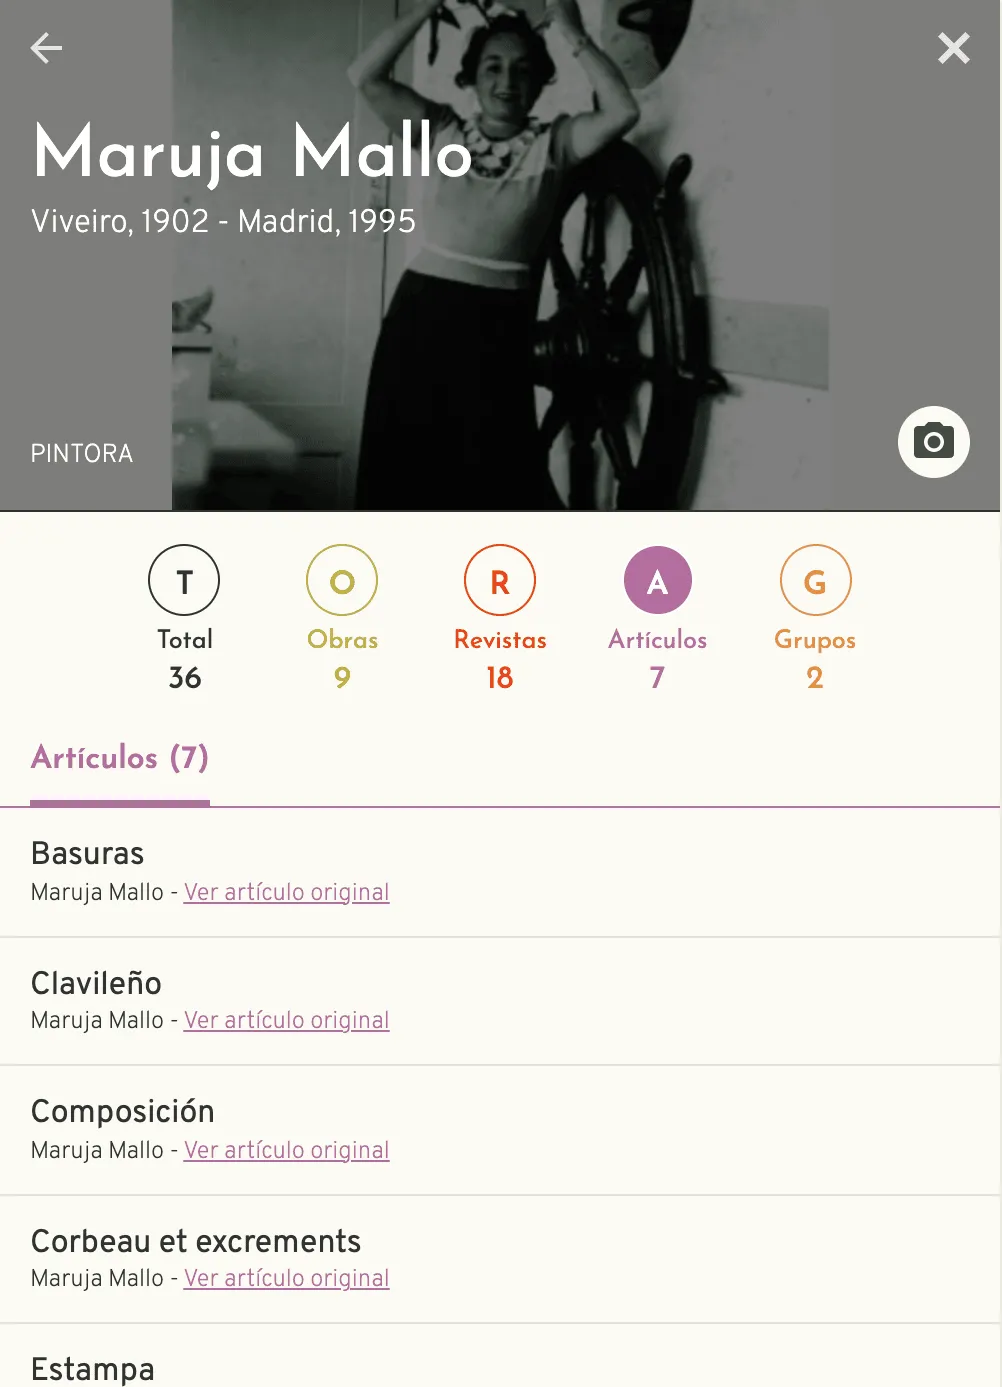
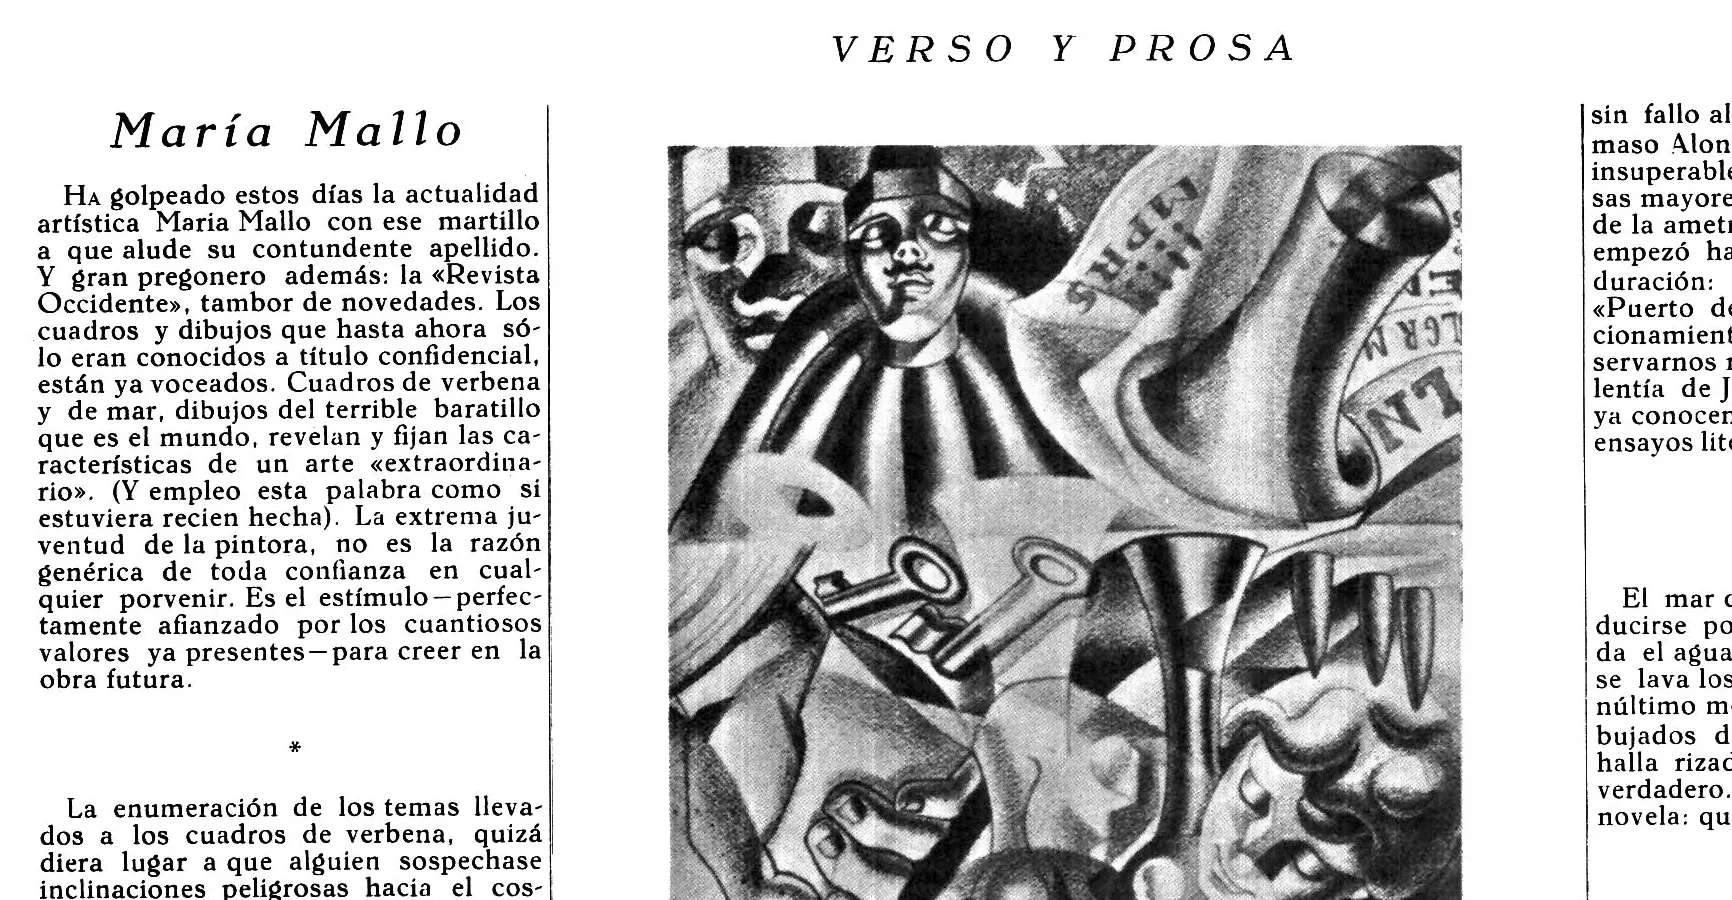
At the Residencia de Estudiantes, the famous Spanish cultural institution, an amazing project was undertaken: digitize and classify all the magazines’ articles published during the Spanish “Silver Age”. The result was an awesome database of texts from Spain's brightest thinkers, writers, and artists, such as the philosopher María Zambrano, the painter who pioneered surrealism in Spain Maruja Mallo, and the Nobel Prize winner Gabriela Mistral.

The client reached out to me to update an old-fashioned tool used to explore this database, which includes +9,500 articles. Apart from the pleasure of working with such high-quality articles, the project had a technically challenging aspect: pre-processing the position of +20,000 nodes to reduce load time and make them responsive, capture user interaction using canvas, and developing a circular scroll in the individual view so that nothing is missed.

Explore the database to discover which people wrote for the magazines and dive into some of the most interesting articles ever written (mostly in Spanish, as was the Spanish Silver Age).