Hi, I'm Beatriz.

I am a Data Visualization designer and developer, with a strong background in research.

After graduating as a Sociologist and a Advertising & PR, I started my professional career as a researcher. I worked simultaneously doing user research for digital products and carrying out social studies. I loved and I still love being a researcher, but what attracted me the most was finding and communicating revealing insights in a clear and engaging way.

In 2012 I started out on my self-taught Data Visualization journey. That was when code came into my life. I also realized that developing the visualizations was as fun as finding and communicating the research insights. I specially enjoy working with D3.js, in which I specialized.

One year later I started my career as a Data Visualizer. That's 10 years of experience already.

Currently, I work creating unique, made-to-order data visualizations, expressly designed for a specific dataset, so I mainly work with static data, no matter how big or small. I also create reusable data visualizations, for those datasets with identical structure but different content.

I love mails, hearing about new projects and challenges so feel free to contact me with any questions, any data project or even just to say hello.

Click to copy email address

beatriz@visualizados.com

SDGs Performance

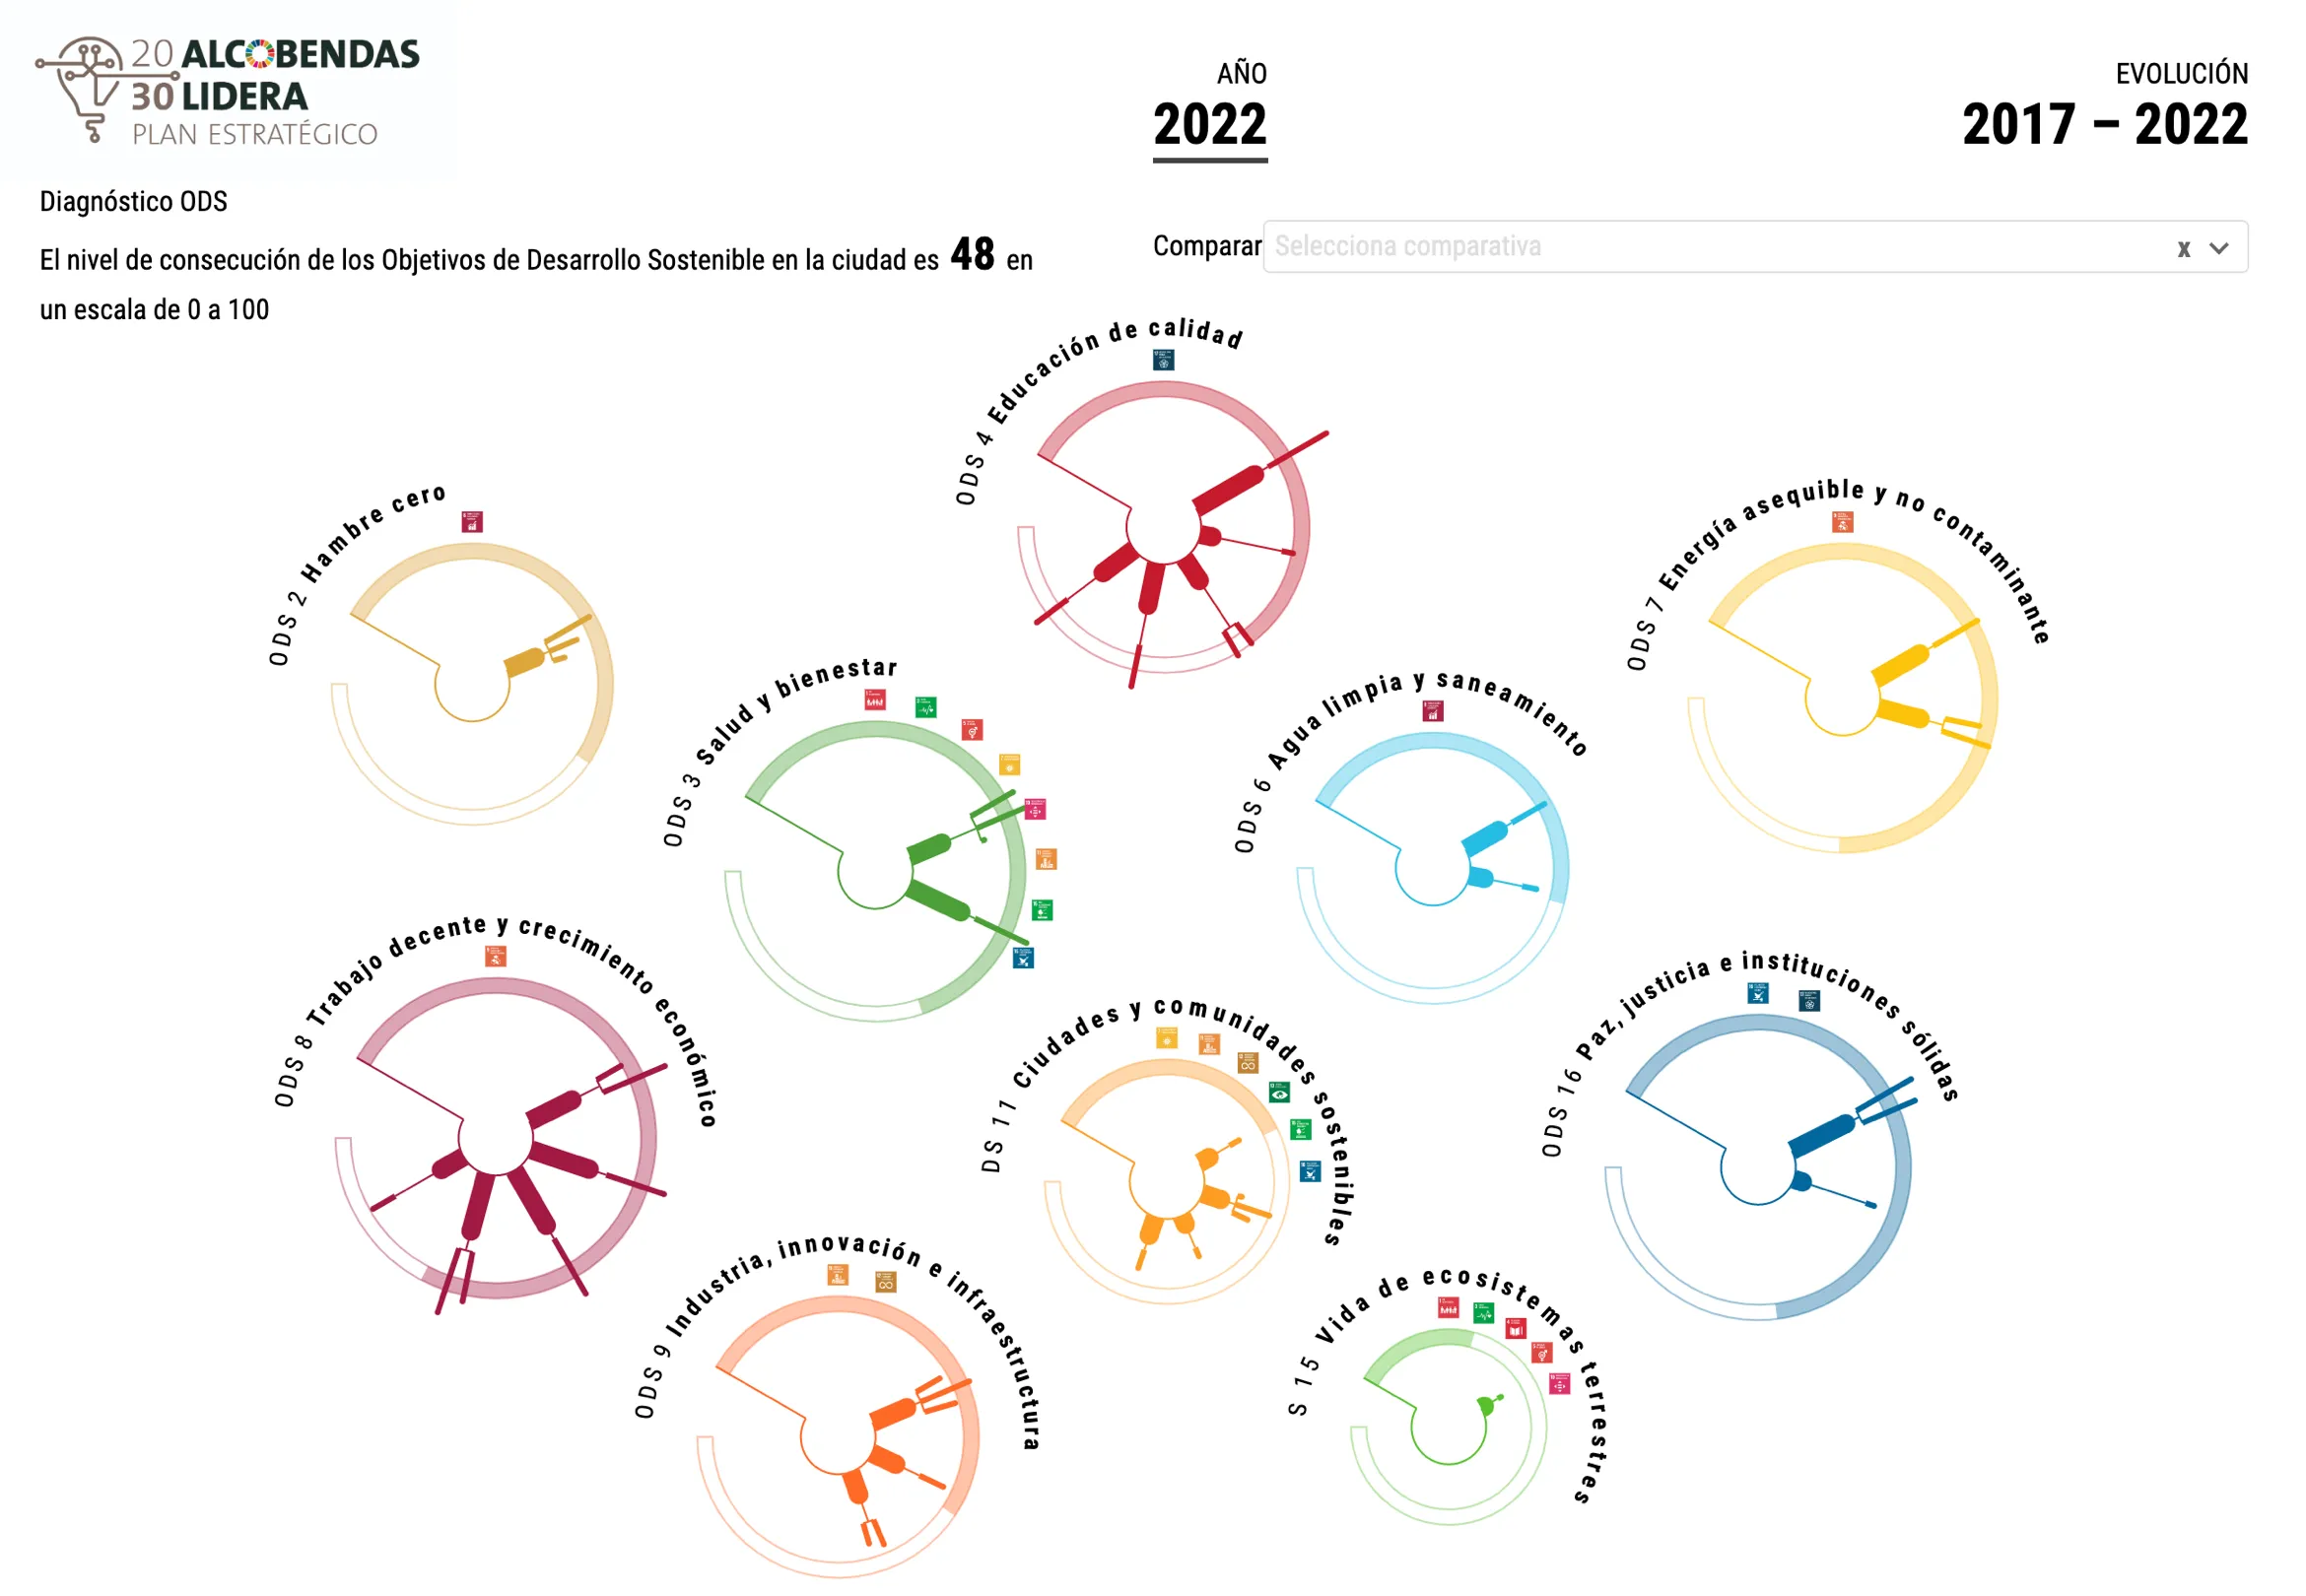
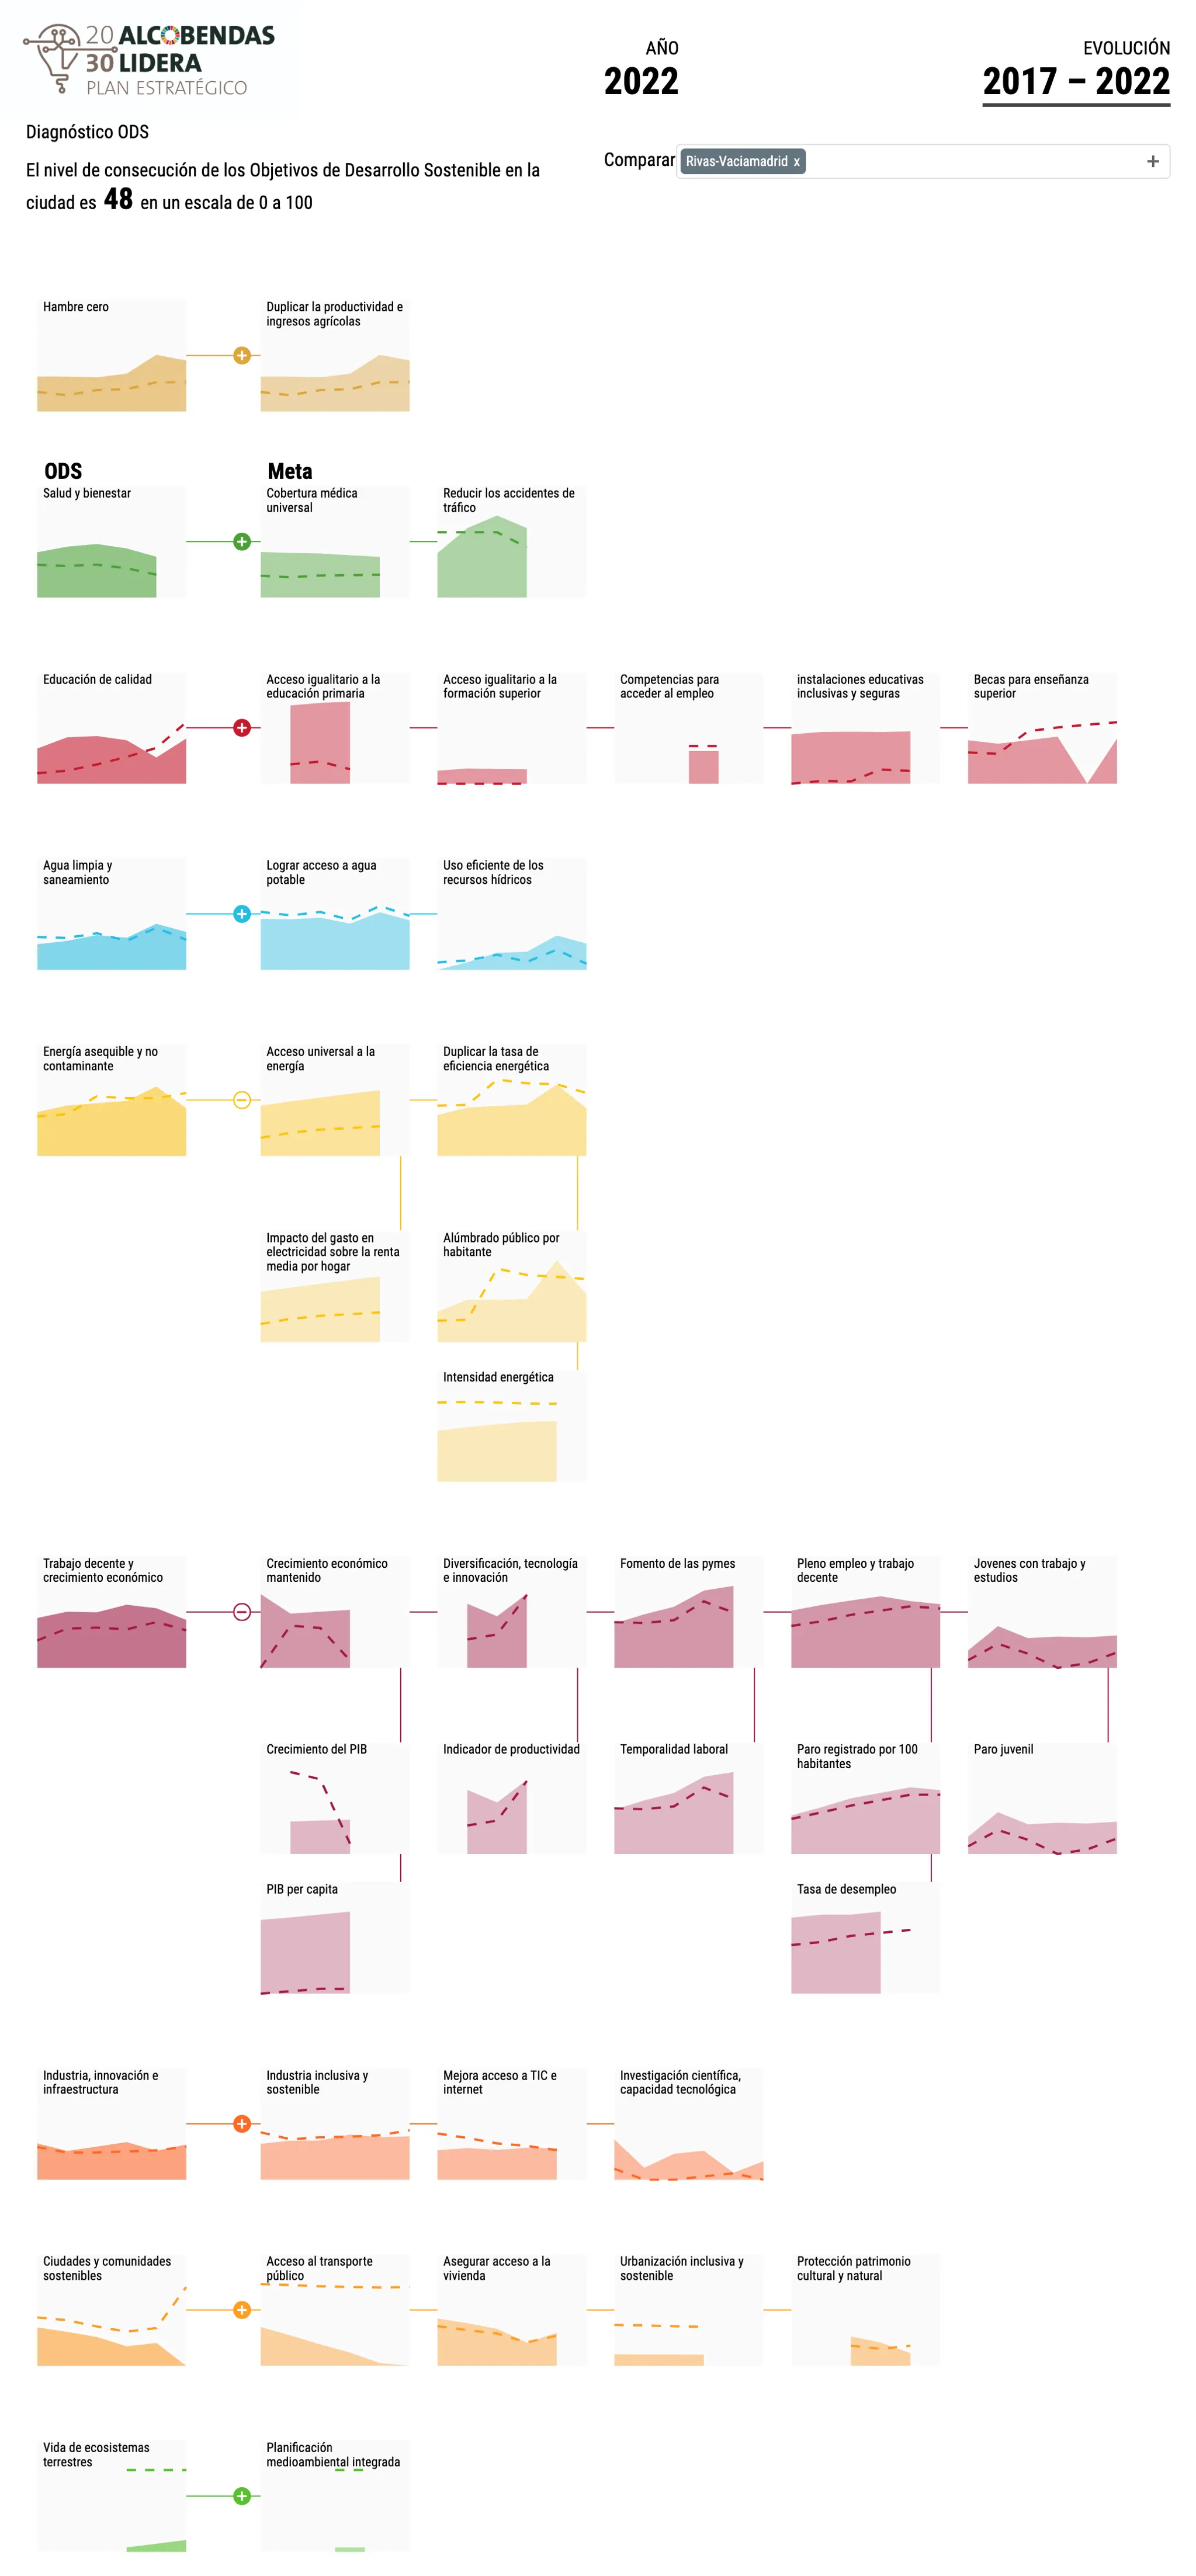
At Smart & City, they are experts in measuring the impact of public policies on the SDGs. They needed a visual way to present their results, both for their direct clients and for them to communicate their results to the general public.

I crafted a completely customized data visualization that includes an initial view with a set of circular trees representing the latest available year's data. For showing the evolution of indicators over time, I developed collapsible small multiples so the users can explore more than 100 indicators little by little, in an organized and intuitive manner. Both views' design was determined by the hierarchical nature of the data.