-
Conversaciones
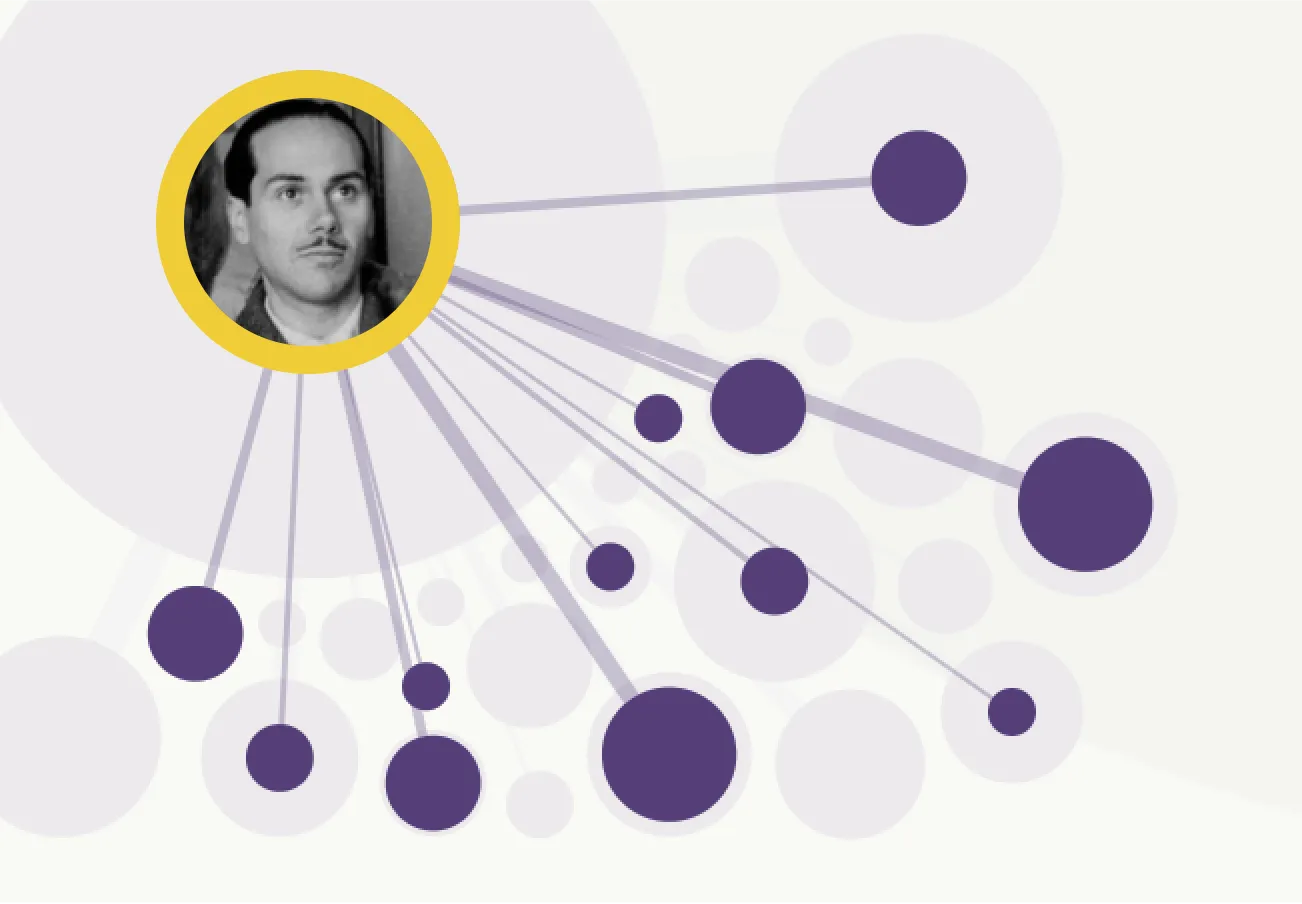
Explore the conversations between Lorca, Dalí and many other spanish artists who stay at the Residencia de Estudiantes during their formative years. This legendary Spanish cultural institution treasures thousands of letters from "La Edad de Plata", a golden age of Spanish culture in early 20th century. They wanted to make them public, so we helped them to visualize and explore the content in a modern and beatiful interface. In collaboration with Populate.
Web & visualization design; D3.js development. -
Revistas de la Edad de Plata
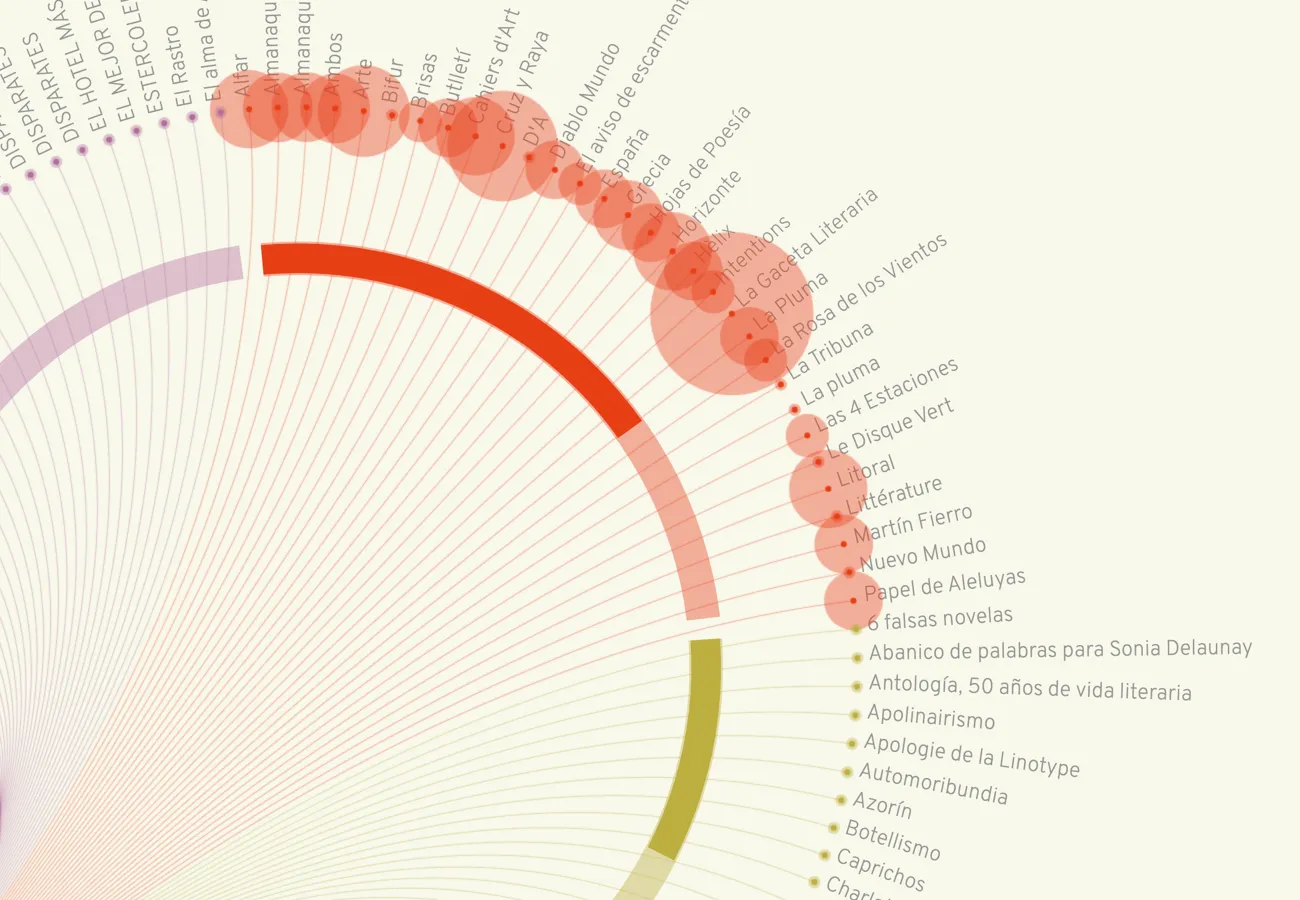
Discover and explore the magazines, the protagonists and their articles and thoughts from the Spanish avant-garde. Project developed for the nonprofit Residencia de Estudiantes and the Institución Libre de Enseñanza. A cultural institution and an educational project founded in the early years 20th century, with a significant impact on the renovation of the intellectual life within the Spanish culture of the time.
Web & visualization design; D3.js development. -
Energy consumption & lifestyle
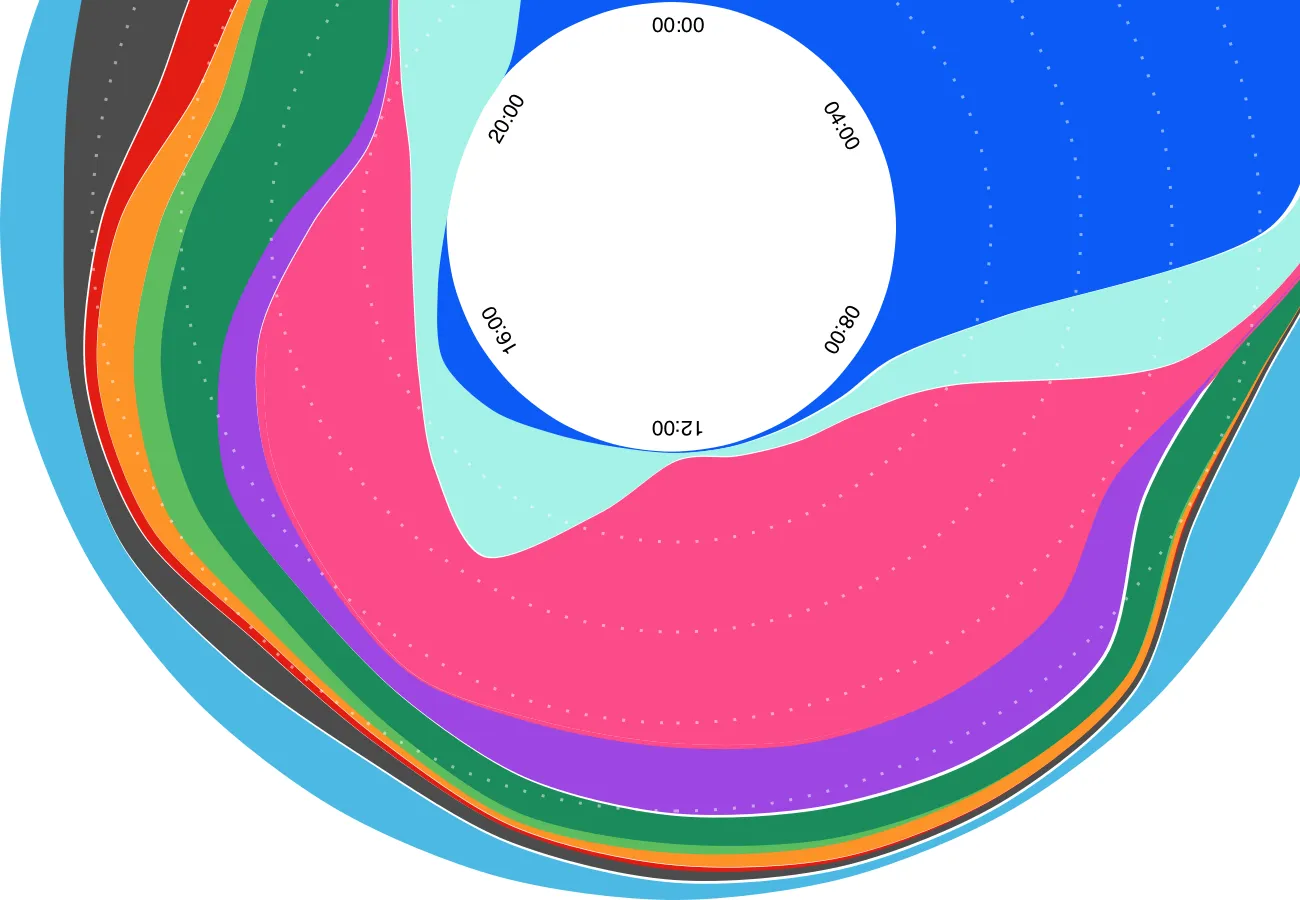
After analysing the everyday energy consumption in millions of households, applying temporal series analysis and clustering techniques, we merge the results with the Time Use Survey open data to contextualize and enhance the data. The final result is a scrollytelling where the data and their stories are mixed in a narrative way. Together with Populate and Webedia.
R data analysis and modelling, information design and visualizations D3.js development. -
Women fertility & Age
Scrollytelling aimed to explain to what extent women's fertility decreases with the age. Followed by an Assisted Reproduction Techniques recommender, based on the success rates data and the woman age.
Desk research, data analysis, information & visual design and web development. -
Air Pollution & Health
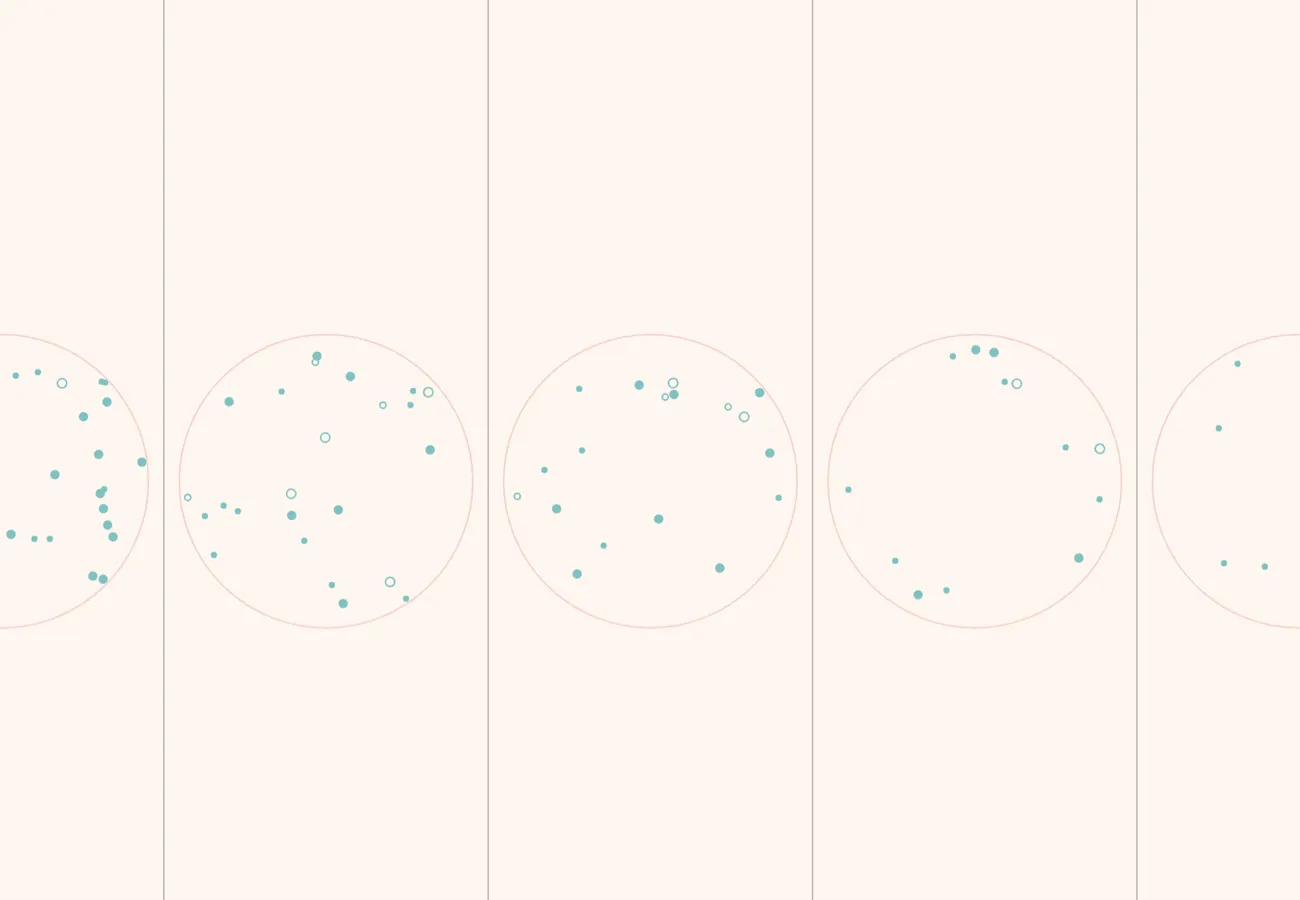
Explore the relation between medical emergencies and air pollution for every week from 2011 to 2017. This visualization piece has been developed inside the Sanitas Data Salud portal, aimed to reveal information found on data related to the health.
Visualization design and code. -
Fundación Cerezales Antonino y Cinia
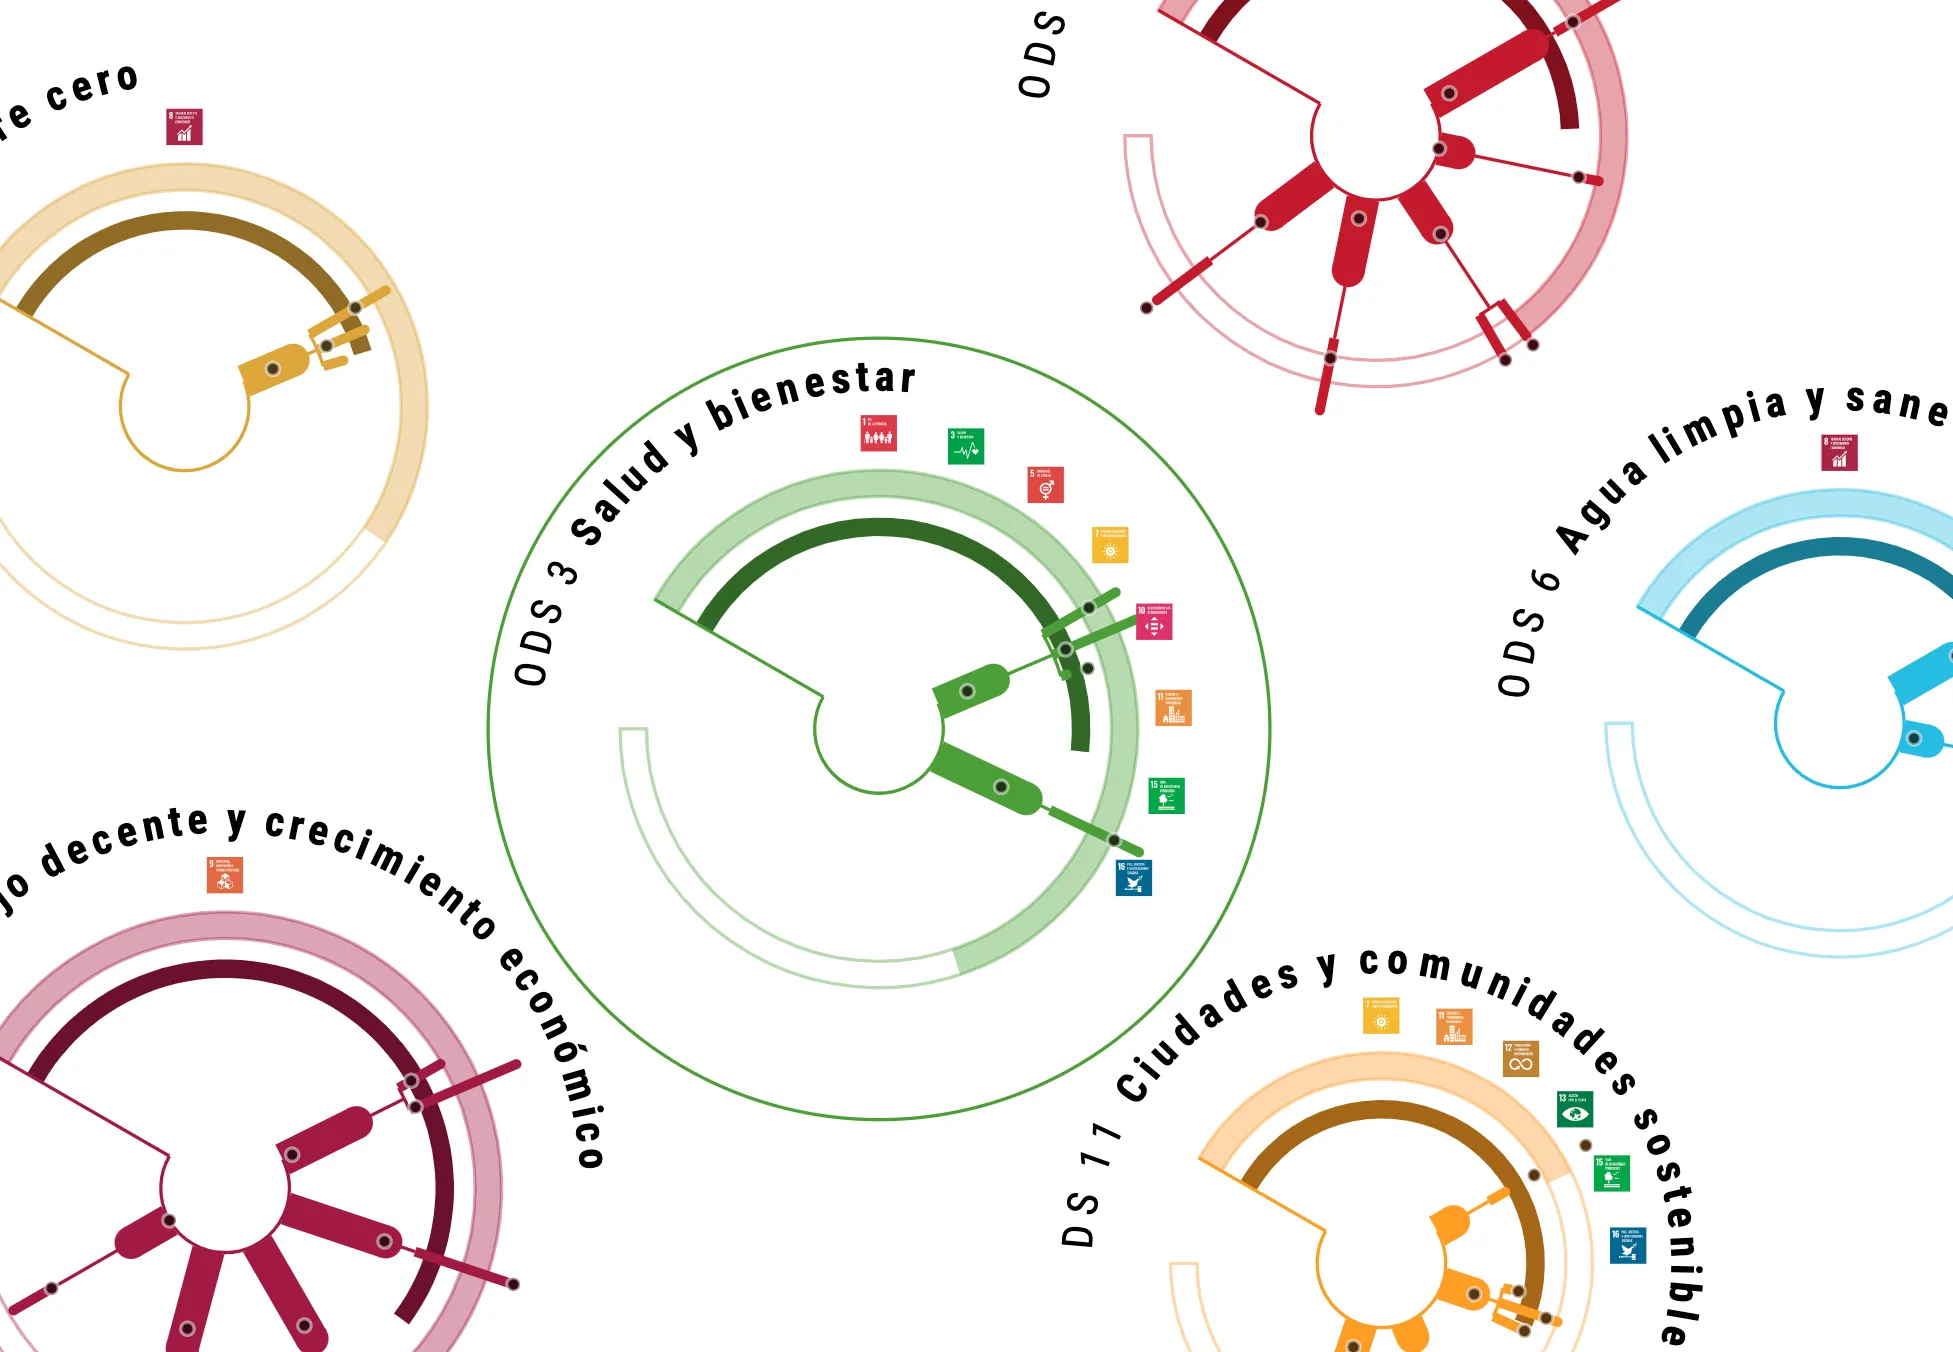
Web and interactive visualization to show the last five years of the FCAYC NGO activity.
The main visualization was designed based on the client requirements:
- show the evolution on a timeline
- and the interrelationships among the multiple activity categories.
Data analysis developed with R, visualization built with D3.js and web development from a html5Up template. -
Urban Data Platform
European Commission's data sharing and visualization platform for European cities and regions: explore and compare the performance in any city in Europe in multiple fields such as demography, resource efficiency, urban development, enviroment, etc...
Designed and developed together with Randbee. -
Dental Health Habits
Mobile first project to share the main insights found in the Spanish Dental Health Habits survey run by Sanitas, one of the leading health insurers in Europe.
Data analysis, information & visual design and web development. -
UE asylum: an unequal right
First prize team project developed for the Madrid Data Journalism Work Group.
The objective was to reveal the inequality suffered by the refugees to access to the asylum right in the European Union.
My work on this project involved the following tasks: data treatment and analysis developed with R, visualizations built with D3.js and web design and development from a html5Up template. -
España en cifras
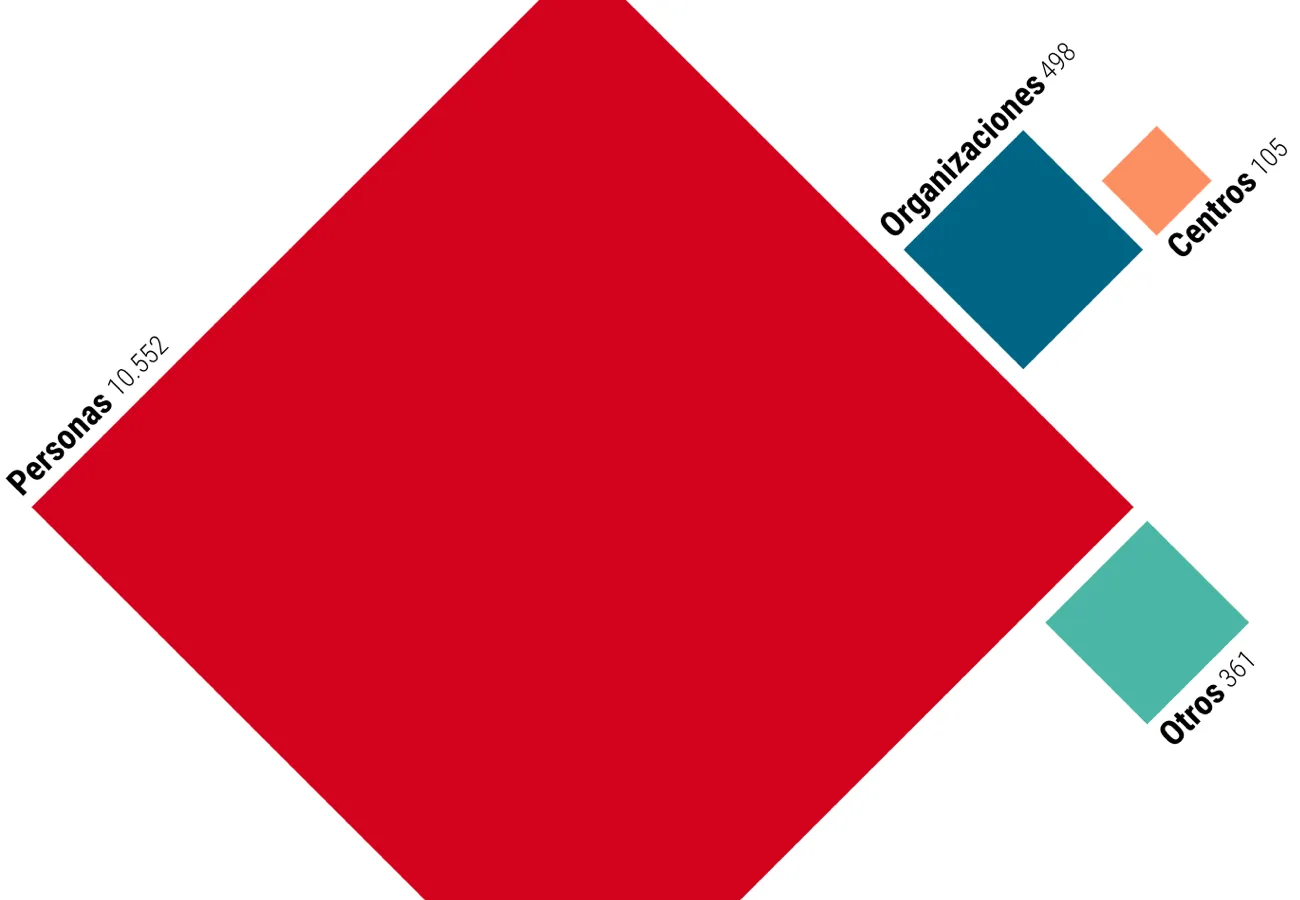
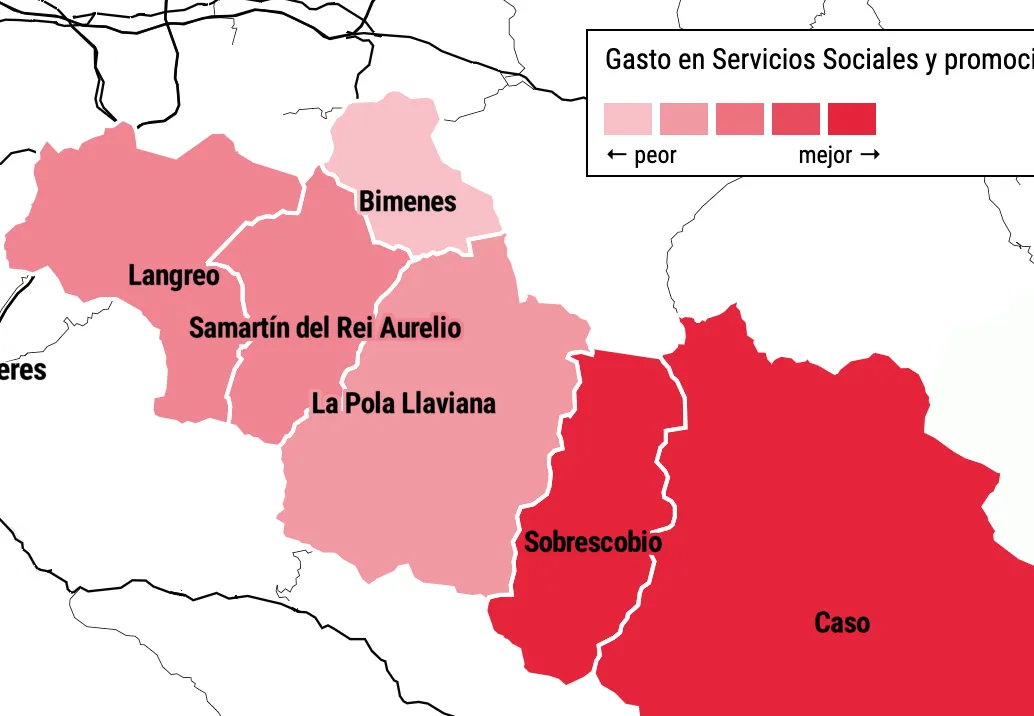
España en cifras is reference webpage where you can find the main figures for each of the 8119 municipalities in Spain (budget, public debt, unemployment rate, household rent, population distribution, elections results...).
In this project, I was in charge of visualizations development, built with D3.js.
Developed together with @populate for the spanish digital journal El Español. -
Where the MadMoney Goes
Built to analyze the consumer geographical behaviour and discover the relationship between buying outside/inside the neighborhood and the presence of chain stores (such as Zara, El Corte Inglés, Ikea...)
The idea behind the project is to promote the proximity shopping by helping entrepreneurs to make decisions about which kind of commerce could make sense in the areas they are thinking to set up a business.
Both, data analysis and visualization were developed in R.